Download
1 / 52
520 likes | 608 Views
Explore the fluctuating trends in case filings from 1999 to 2009 across states like Maine, Massachusetts, New Hampshire, Rhode Island, Puerto Rico, Connecticut, New York, Vermont, Delaware, New Jersey, Pennsylvania, Maryland, North Carolina, South Carolina, Virginia, West Virginia, Louisiana, Mississippi, Texas, and Kentucky. While many states experienced a drop in filings in 2006, recent years have seen significant increases, with some states reporting up to a 214% rise in filings. Dive into the data and track the shifts in legal proceedings over a decade.

E N D
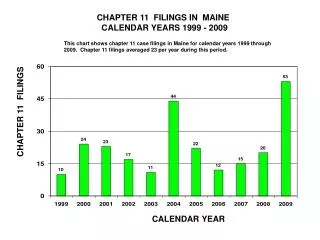
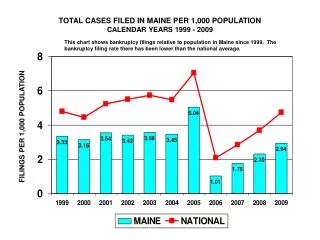
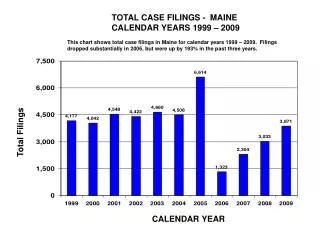
TOTAL CASE FILINGS - MAINE CALENDAR YEARS 1999 – 2009 This chart shows total case filings in Maine for calendar years 1999 – 2009. Filings dropped substantially in 2006, but were up by 193% in the past three years. Total Filings CALENDAR YEAR
TOTAL CASE FILINGS - MASSACHUSETTS CALENDAR YEARS 1999 – 2009 This chart shows total case filings in Massachusetts for calendar years 1999 – 2009. Filings dropped substantially in 2006, but were up by 150% in the past three years. Total Filings CALENDAR YEAR
TOTAL CASE FILINGS - NEW HAMPSHIRE CALENDAR YEARS 1999 – 2009 This chart shows total case filings in New Hampshire for calendar years 1999 – 2009. Filings dropped substantially in 2006, but were up by 172% in the last three years. Total Filings CALENDAR YEAR
TOTAL CASE FILINGS - RHODE ISLAND CALENDAR YEARS 1999 – 2009 This chart shows total case filings in Rhode island for calendar years 1999 – 2009. Filings dropped substantially in 2006, but were up by 214% in the last three years. Total Filings CALENDAR YEAR
TOTAL CASE FILINGS - PUERTO RICO CALENDAR YEARS 1999 – 2009 This chart shows total case filings in Puerto Rico for calendar years 1999 – 2009. Filings dropped substantially in 2006, but have increased by 108% in the last three years. Total Filings CALENDAR YEAR
TOTAL CASE FILINGS - CONNECTICUT CALENDAR YEARS 1999 – 2009 This chart shows total case filings in Connecticut for calendar years 1999 – 2009. Filings dropped substantially in 2006, but have increased by 106% in the last three years. Total Filings CALENDAR YEAR
TOTAL CASE FILINGS - NEW YORK CALENDAR YEARS 1999 – 2009 This chart shows total case filings in New York for calendar years 1999 – 2009. Filings dropped substantially in 2006, but were up by 91% in the last three years. Total Filings CALENDAR YEAR
TOTAL CASE FILINGS - VERMONT CALENDAR YEARS 1999 – 2009 This chart shows total case filings in Vermont for calendar years 1999 – 2009. Filings dropped substantially in 2006, but were up by 138% in the last three years. Total Filings CALENDAR YEAR
TOTAL CASE FILINGS - DELAWARE CALENDAR YEARS 1999 – 2009 This chart shows total case filings in Delaware for calendar years 1999 – 2009. Filings dropped substantially in 2006, but were up by 203% in the last two years. Total Filings CALENDAR YEAR
TOTAL CASE FILINGS - NEW JERSEY CALENDAR YEARS 1999 – 2009 This chart shows total case filings in New Jersey for calendar years 1999 – 2009. Filings dropped substantially in 2006, but were up by 158% in the last three years. Total Filings CALENDAR YEAR
TOTAL CASE FILINGS - PENNSYLVANIA CALENDAR YEARS 1999 – 2009 This chart shows total case filings in Pennsylvania for calendar years 1999 – 2009. Filings dropped substantially in 2006, but were up by 60% in the last three years. Total Filings CALENDAR YEAR
TOTAL CASE FILINGS - MARYLAND CALENDAR YEARS 1999 – 2009 This chart shows total case filings in Maryland for calendar years 1999 – 2009. Filings dropped substantially in 2006, but were up by 181% in the last two years. Total Filings CALENDAR YEAR
TOTAL CASE FILINGS - NORTH CAROLINA CALENDAR YEARS 1999 – 2009 This chart shows total case filings in North Carolina for calendar years 1999 – 2009. Filings dropped substantially in 2006, but were up by 61% in the last three years. Total Filings CALENDAR YEAR
TOTAL CASE FILINGS - SOUTH CAROLINA CALENDAR YEARS 1999 – 2009 This chart shows total case filings in South Carolina for calendar years 1999 – 2009. Filings dropped substantially in 2006, but were up by 60% in the last three years. Total Filings CALENDAR YEAR
TOTAL CASE FILINGS - VIRGINIA CALENDAR YEARS 1999 – 2009 This chart shows total case filings in Virginia for calendar years 1999 – 2009. Filings dropped substantially in 2006, but were up by 177% in the last three years. Total Filings CALENDAR YEAR
TOTAL CASE FILINGS - WEST VIRGINIA CALENDAR YEARS 1999 – 2009 This chart shows total case filings in West Virginia for calendar years 1999 – 2009. Filings dropped substantially in 2006, but were up by 120% in the last three years. Total Filings CALENDAR YEAR
TOTAL CASE FILINGS - LOUISIANA CALENDAR YEARS 1999 – 2009 This chart shows total case filings in Louisiana for calendar years 1999 – 2009. Filings dropped substantially in 2006, but were up by 39% in the last two years. Total Filings CALENDAR YEAR
TOTAL CASE FILINGS - MISSISSIPPI CALENDAR YEARS 1999 – 2009 This chart shows total case filings in Mississippi for calendar years 1999 – 2009. Filings dropped substantially in 2006, but were up by 67% in the last three years. Total Filings CALENDAR YEAR
TOTAL CASE FILINGS - TEXAS CALENDAR YEARS 1999 – 2009 This chart shows total case filings in Texas for calendar years 1999 – 2009. Filings dropped substantially in 2006, but were up by 51% in the last three years. Total Filings CALENDAR YEAR
TOTAL CASE FILINGS - KENTUCKY CALENDAR YEARS 1999 – 2009 This chart shows total case filings in Kentucky for calendar years 1999 – 2009. Filings dropped substantially in 2006, but were up by 104% in the last three years. Total Filings CALENDAR YEAR
TOTAL CASE FILINGS - MICHIGAN CALENDAR YEARS 1999 – 2009 This chart shows total case filings in Michigan for calendar years 1999 – 2009. Filings dropped substantially in 2006, but were up by 107% in the last three years. Total Filings CALENDAR YEAR
TOTAL CASE FILINGS - OHIO CALENDAR YEARS 1999 – 2009 This chart shows total case filings in Ohio for calendar years 1999 – 2009. Filings dropped substantially in 2006, but were up by 100% in the last three years. Total Filings CALENDAR YEAR
TOTAL CASE FILINGS - TENNESSEE CALENDAR YEARS 1999 – 2009 This chart shows total case filings in Tennessee for calendar years 1999 – 2009. Filings dropped substantially in 2006, but were up by 71% in the last three years. Total Filings CALENDAR YEAR
TOTAL CASE FILINGS - ILLINOIS CALENDAR YEARS 1999 – 2009 This chart shows total case filings in Illinois for calendar years 1999 – 2009. Filings dropped substantially in 2006, but were up by 144% in the last three years. Total Filings CALENDAR YEAR
TOTAL CASE FILINGS - INDIANA CALENDAR YEARS 1999 – 2009 This chart shows total case filings in Indiana for calendar years 1999 – 2009. Filings dropped substantially in 2006, but were up by 117% in the last three years. Total Filings CALENDAR YEAR
TOTAL CASE FILINGS - WISCONSIN CALENDAR YEARS 1999 – 2009 This chart shows total case filings in Wisconsin for calendar years 1999 – 2009. Filings dropped substantially in 2006, but were up by 146% in the last three years. Total Filings CALENDAR YEAR
TOTAL CASE FILINGS - ARKANSAS CALENDAR YEARS 1999 – 2009 This chart shows total case filings in Arkansas for calendar years 1999 – 2009. Filings dropped substantially in 2006, but were up by 73% in the last three years. Total Filings CALENDAR YEAR
TOTAL CASE FILINGS - IOWA CALENDAR YEARS 1999 – 2009 This chart shows total case filings in Iowa for calendar years 1999 – 2009. Filings dropped substantially in 2006, but were up by 108% in the last three years. Total Filings CALENDAR YEAR
TOTAL CASE FILINGS - MINNESOTA CALENDAR YEARS 1999 – 2009 This chart shows total case filings in Minnesota for calendar years 1999 – 2009. Filings dropped substantially in 2006, but were up by 167% in the last three years. Total Filings CALENDAR YEAR
TOTAL CASE FILINGS - MISSOURI CALENDAR YEARS 1999 – 2009 This chart shows total case filings in Missouri for calendar years 1999 – 2009. Filings dropped substantially in 2006, but were up by 99% in the last three years. Total Filings CALENDAR YEAR
TOTAL CASE FILINGS - NEBRASKA CALENDAR YEARS 1999 – 2009 This chart shows total case filings in Nebraska for calendar years 1999 – 2009. Filings dropped substantially in 2006, but were up by 82% in the last three years. Total Filings CALENDAR YEAR
TOTAL CASE FILINGS - NORTH DAKOTA CALENDAR YEARS 1999 – 2009 This chart shows total case filings in North Dakota for calendar years 1999 – 2009. Filings dropped substantially in 2006, but were up by 114% in the last three years. Total Filings CALENDAR YEAR
TOTAL CASE FILINGS - SOUTH DAKOTA CALENDAR YEARS 1999 – 2009 This chart shows total case filings in South Dakota for calendar years 1999 – 2009. Filings dropped substantially in 2006, but were up by 98% in the last three years. Total Filings CALENDAR YEAR
TOTAL CASE FILINGS - ALASKA CALENDAR YEARS 1999 – 2009 This chart shows total case filings in Alaska for calendar years 1999 – 2009. Filings dropped substantially in 2006, but were up by 60% in the last three years. Total Filings CALENDAR YEAR
TOTAL CASE FILINGS - ARIZONA CALENDAR YEARS 1999 – 2009 This chart shows total case filings in Arizona for calendar years 1999 – 2009. Filings dropped substantially in 2006, but were up by 344% in the last three years. Total Filings CALENDAR YEAR
TOTAL CASE FILINGS - CALIFORNIA CALENDAR YEARS 1999 – 2009 This chart shows total case filings in California for calendar years 1999 – 2009. Filings dropped substantially in 2006, but were up by 435% in the last two years. Total Filings CALENDAR YEAR
TOTAL CASE FILINGS - HAWAII CALENDAR YEARS 1999 – 2009 This chart shows total case filings in Hawaii for calendar years 1999 – 2009. Filings dropped substantially in 2006, but were up by 224% in the last three years. Total Filings CALENDAR YEAR
TOTAL CASE FILINGS - IDAHO CALENDAR YEARS 1999 – 2009 This chart shows total case filings in Idaho for calendar years 1999 – 2009. Filings dropped substantially in 2006, but were up by 163% in the last three years. Total Filings CALENDAR YEAR
TOTAL CASE FILINGS - MONTANA CALENDAR YEARS 1999 – 2009 This chart shows total case filings in Montana for calendar years 1999 – 2009. Filings dropped substantially in 2006, but were up by 50% in the last three years. Total Filings CALENDAR YEAR
TOTAL CASE FILINGS - NEVADA CALENDAR YEARS 1999 – 2009 This chart shows total case filings in Nevada for calendar years 1999 – 2009. Filings dropped substantially in 2006, but were up by 440% in the last three years. Total Filings CALENDAR YEAR
TOTAL CASE FILINGS - OREGON CALENDAR YEARS 1999 – 2009 This chart shows total case filings in Oregon for calendar years 1999 – 2009. Filings dropped substantially in 2006, but were up by 142% in the last three years. Total Filings CALENDAR YEAR
TOTAL CASE FILINGS - WASHINGTON CALENDAR YEARS 1999 – 2009 This chart shows total case filings in Washington for calendar years 1999 – 2009. Filings dropped substantially in 2006, but were up by 165% in the last three years. Total Filings CALENDAR YEAR
TOTAL CASE FILINGS - COLORADO CALENDAR YEARS 1999 – 2009 This chart shows total case filings in Colorado for calendar years 1999 – 2009. Filings dropped substantially in 2006, but were up by 184% in the last three years. Total Filings CALENDAR YEAR
TOTAL CASE FILINGS - KANSAS CALENDAR YEARS 1999 – 2009 This chart shows total case filings in Kansas for calendar years 1999 – 2009. Filings dropped substantially in 2006, but were up by 73% in the last three years. Total Filings CALENDAR YEAR
TOTAL CASE FILINGS - NEW MEXCIO CALENDAR YEARS 1999 – 2009 This chart shows total case filings in New Mexico for calendar years 1999 – 2009. Filings dropped substantially in 2006, but were up by 143% in the last three years. Total Filings CALENDAR YEAR
TOTAL CASE FILINGS - OKLAHOMA CALENDAR YEARS 1999 – 2009 This chart shows total case filings in Oklahoma for calendar years 1999 – 2009. Filings dropped substantially in 2006, but were up by 99% in the last three years. Total Filings CALENDAR YEAR
TOTAL CASE FILINGS - UTAH CALENDAR YEARS 1999 – 2009 This chart shows total case filings in Utah for calendar years 1999 – 2009. Filings dropped substantially in 2006, but were up by 177% in the last three years. Total Filings CALENDAR YEAR
TOTAL CASE FILINGS - WYOMING CALENDAR YEARS 1999 – 2009 This chart shows total case filings in Wyoming for calendar years 1999 – 2009. Filings dropped substantially in 2006, but were up by 96% in the last three years. Total Filings CALENDAR YEAR
TOTAL CASE FILINGS - ALABAMA CALENDAR YEARS 1999 – 2009 This chart shows total case filings in Alabama for calendar years 1999 – 2009. Filings dropped substantially in 2006, but were up by 78% in the last three years. Total Filings CALENDAR YEAR
TOTAL CASE FILINGS - FLORIDA CALENDAR YEARS 1999 – 2009 This chart shows total case filings in Florida for calendar years 1999 – 2009. Filings dropped substantially in 2006, but were up by 278% in the last three years. Total Filings CALENDAR YEAR