Download
1 / 7
70 likes | 149 Views
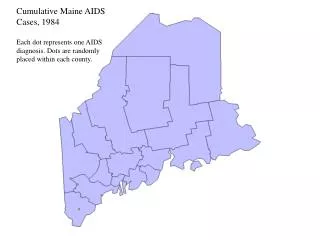
Explore the cumulative number of AIDS cases in Maine from 1984 to 2002. Each dot represents a diagnosis placed within counties. Witness the progression of the disease over the years.

E N D
Cumulative Maine AIDS Cases, 1984Each dot represents one AIDS diagnosis. Dots are randomly placed within each county.
Cumulative Maine AIDS Cases, 1987 Each dot represents one AIDS diagnosis. Dots are randomly placed within each county.
Cumulative Maine AIDS Cases, 1990 Each dot represents one AIDS diagnosis. Dots are randomly placed within each county.
Cumulative Maine AIDS Cases, 1993 Each dot represents one AIDS diagnosis. Dots are randomly placed within each county.
Cumulative Maine AIDS Cases, 1996 Each dot represents one AIDS diagnosis. Dots are randomly placed within each county.
Cumulative Maine AIDS Cases, 1999 Each dot represents one AIDS diagnosis. Dots are randomly placed within each county.
Cumulative Maine AIDS Cases, 2002Each dot represents one AIDS diagnosis. Dots are randomly placed within each county.