Statistical Methods for Analyzing Ordered Gene Expression Microarray Data
Statistical Methods for Analyzing Ordered Gene Expression Microarray Data. Shyamal D. Peddada Biostatistics Branch National Inst. Environmental Health Sciences (NIH) Research Triangle Park, NC. An outline. Ordered gene expression data Common experimental designs

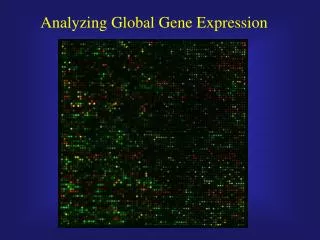
Statistical Methods for Analyzing Ordered Gene Expression Microarray Data
E N D
Presentation Transcript
Statistical Methods for Analyzing Ordered Gene Expression Microarray Data Shyamal D. PeddadaBiostatistics Branch National Inst. Environmental Health Sciences (NIH)Research Triangle Park, NC
An outline • Ordered gene expression data • Common experimental designs • A review of some statistical methods • An example • Demonstration of ORIOGEN – a software for ordered gene expression data
Some examples of ordered gene expression data • Comparison of gene expression by: • various stages of cancer • Normal - Hyperplasia – Adenoma – Carcinoma • tumor size • New tumor – Middle Size – Large tumor (with necrosis) • dose of a chemical (dose-response study) • duration of exposure to a chemical (time-course experiments) • dose & duration
Some commonly used experimental designs • Experimental unit: Tissues/cells/animals • Single chemical/treatment • Dose response study • Time course study • single dose but responses obtained at multiple time points after treatment • experimental units are treated at multiple time points using the same dose. • Dose response x Time course study • Multiple doses at multiple time points • Multi chemicals/treatments
Possible objectives • Investigate changes in gene expression at certain biologically relevant category. • E.g. Hyperplasia to Adenoma to Carcinoma • E.g. “early time point” to “late time point” since the exposure to a chemical • Identify/cluster genes with similar expression profiles over time/dose.
Correlation coefficient based methods • Correlation coefficient based methods match genes with similar observed patterns of expression across dose/time points. Gene 2 Gene 1
Correlation coefficient based methods A number of variations to this general principle exist in the literature. Here we outline some prominent ones. • Chu et al. (Science, 1998): • Pre-select a set of biologically relevant patterns of gene expressions over time. • Identify a sample of about 3 to 8 genes for each pattern. • Compute the correlation coefficient of each candidate gene in the microarray data with the above pre-selected genes. • Cluster each candidate gene into the cluster with highest correlation coefficient
Correlation coefficient based methods … • Kerr and Churchill (PNAS, 2001): They correctly recognized the uncertainty associated with Chu et al. ‘s clustering algorithm. Hence they proposed a bootstrap methodology to evaluate Chu et al.’s clusters. C. Heyer et al. (Genome Research, 1999): • Rather than using the standard correlation coefficient between genes, they employ jackknife version which robustifies against outliers. • Unlike Chu et al.’s strategy, they classify genes on the basis of pairwise correlation coefficients.
Correlation coefficient based methods … Strengths • Familiarity among biologists • Easy to compute and interpret (although it is often misinterpreted too!) Weakness • Non-linearity in the data can lead to misinterpretation • Outliers and influential observations can affect the numerical value of the correlation coefficient. • Heterogeneity between genes can also affect the numerical value of the correlation coefficient. • It is also important to note that correlation coefficient is typically estimated on the basis of a very small number of points.
Regression based procedures Basic assumption among these methods:The “conditions” are numerical, e.g. dose or time
Polynomial regressionLiu et al. (BMC Bioinformatics, 2005) For each gene Liu et al. fitted a quadratic regression model: They cluster each gene into a particular cluster depending upon the sign and statistical significance of the regression parameters. If for a gene none of the regression coefficients are significant then such a gene is declared un-important.
Polynomial regressionLiu et al. (BMC Bioinformatics, 2005) Strengths: • Biologists are reasonably familiar with quadratic regression analysis. • Regression coefficients are easy to interpret. • For small number of doses or time points and for evenly spaced doses, a quadratic model may be a reasonable approximation. • An easy to use EXCEL based software is available.
Polynomial regression Liu et al. (BMC Bioinformatics, 2005) Two major limitations because it is fully parametric: 1. Departure from quadratic model is common: In such cases the quadratic model may not be correct. 2. Normality assumption need not be valid. Time
“Semi-parametric” regression methods Several authors have tried semi-parametric regression approach to gene expression data. E.g. • deHoon et al. (Bioinformatics, 2002) • Bar-Joseph et al. (PNAS, 2003, Bioinformatics, 2004) • Luan and Li et al. (Bioinformatics, 2003) • Storey et al. (PNAS, 2005)
Storey et al. (2005) Basic idea: For each gene, they fit mixed effects model with a B-spline basis. This methodology is largely based on Brumback and Rice (JASA, 1998). Statistical significance of each gene is evaluated using an F like test statistic with P-value (q-value) determined by bootstrap.
Storey et al. (2005) Strengths: • It is semi-parametric • A user friendly software called EDGE is available Limitations: • It does not perform well for “threshold” patterns of gene expression • The “conditions” should be numerical • Unequal dose or time spacing can have an impact on the performance of the procedure
Order Restricted Inference for Ordered Gene ExpressioN(ORIOGEN) Peddada et al. (Bioinformatics, 2003, 2005) Simmons and Peddada (Bioinformation, 2007)
Temporal Profile /Dose Response • Pattern of the (unknown) mean expression of a gene over time (dose) is known as the temporal profile (dose response) of a gene. • ORIOGEN: uses mathematical (in)equalities to describe a profile.
Some Examples • Null profile:
Examples Continued … • Up-down profile with maximum at 3 hours
Examples Continued … • Non-increasing profile • Cyclical profile
ORIOGEN • Step 1 (Profile specification): Pre-specify the shapes of profiles of interest.
ORIOGEN … • Step 2 (profile fitting): Fit each pre-specified profile to each gene using the estimation procedure described in: Hwang and Peddada (1994, Ann. of Stat.)
Definitions • Linked parameters: Two parameters are said to be linked if the inequality between them is known a priori. • Nodal parameter: A parameter is said to be nodal if it is linked to all parameters in the graph. • For any given profile, the estimation always starts at the nodal parameter.
Pool the Adjacent Violator Algorithm (PAVA) • Hypothesis: • Observed data • Isotonized data (PAVA)
Estimation: The General Idea 3 is the only nodal parameter 3 4 2 3 5 1 4 5 2 1
Estimation Continued … From this sub-graph we estimate 1 and 2. 3 2 1
A Measure of “Goodness-of-fit” Norm • Step 3: Determine the norm of a gene corresponding to each temporal profile. This is defined as the maximum (studentized) difference between estimates corresponding to linked parameters. Peddada et al. (2001, Biometrics).
An Example • Observed data: 1, 1.5, 2, 2.5, 1.5, 2.25 • Two pre-specified temporal profiles: (a) (b)
Example Continued … • Fit under profile (a) 1, 1.5, 2.25, 2.25, 1.875, 1.875 • Fit under profile (b) 1, 1.5, 2, 2.5, 1.875, 1.875
Example Continued … • norm for profile (a) is: 2.25 - 1 = 1.25 • norm for profile (b) is: 2.5 - 1 = 1.5
“Best Fitting” Profile • Step 4: Identify the profile with the largest norm. In the example, profile (b) has larger norm than profile (a) . Hence profile (b) is a better fit than (a).
Statistical Significance • Step 5: Statistical significance: • P-value for statistical significance is obtained using the bootstrap methodology:
MCF-7 breast cancer cell treated with 17 -estradiol (Lobenhofer et al., 2002, Mol. Endocrin.). • Gene expressions were measured after: 1hr, 4hrs, 12hrs, 24hrs, 36hrs and 48hrs of treatment. • # of genes on each chip = 1900. • # of samples at each time point = 8
Available softwares • Linear Regression Method (Liu et al., 2005) • EDGE (Storey et al., 2005) • EPIG (Chao et al., 2008) • ORIOGEN (Peddada et al., 2006)
Some open problems • ORIOGEN is potentially subject to Type III error. How do we control FDR & Type III error. • How to deal with • Dependent samples? • Covariates? • Order restricted inference in the context of mixed effects linear models.
Leping Li David Umbach Clare Weinberg Ed Lobenhofer Cynthia Afshari Software developers at Constella Group (late) John Zajd Shawn Harris Acknowledgments