Download
1 / 49
490 likes | 627 Views
Nourishments and shoreline changes uninterrupted coast Egmond-Bergen (The Netherlands). Ruud Spanhoff (RIKZ) and Stijn de Keijzer (University of Amsterdam) Kathelijne Wijnberg and Stefan Aarninkhof (WL | delft hydraulics) Coastview meeting, Bologna, Italy, 4/5 March 2004.

E N D
Nourishments and shoreline changesuninterrupted coast Egmond-Bergen (The Netherlands) Ruud Spanhoff (RIKZ) and Stijn de Keijzer (University of Amsterdam) Kathelijne Wijnberg and Stefan Aarninkhof (WL | delft hydraulics) Coastview meeting, Bologna, Italy, 4/5 March 2004
Objective • Monitor a nourished beach with Argus video remote sensing technology in terms of one or more CSI’s defined in the Coastview project • Analyse relation between seasonal wave forcing and beach evolution
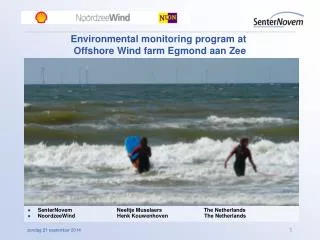
Study area • Egmond (NL), Argus site: Jan van Speijk lighthouse • Beach nourishment: • June 30 – July 5, 2000 • location: y = 0 – 800 m • volume 0.2x10⁶ m3
Data set Morphology: 48 monthly intertidal bathymetries (IBMapper) t range : June 1999 - April 2003 y range: -680 m to +680 m z range: 0/-0.4 m NAP to + 0.9 m NAP ►+0.2 m NAP contour(Mean Tide Level) ►Beach width(0m to +0.9m contour) Hydrodyn.: 3-hourly observations of: ►Hrms, Tpeak, angle of incidence (θ0) (YM6, ELD) ►Water level(IJmuiden, Petten)
Methods (1): morphological data analysis • Temporal evolution of alongshore-averaged MTL position • Temporal evolution of spatial patterns in MTL position set ofspatial patterns empirically defined by EOF method (empirical eigenfunctions) • For comparison to seasonal wave forcing: • linear subsampling to 3-hourly interval • Hanning filter, 90 days window width
Methods (2): seasonal wave forcing • Cross-shore component of nearshore wave energy flux: evaluated at 6m –NAP depth contour • Extract seasonal signal: • Hanning filter • 90 days window width
The data (1) Egmond station ‘Jan van Speyk’ June 1999 - August 2001 Monthly Intertidal Bathymetries(after: Caljouw / Nipius)
The data (2) Egmond station ‘Jan van Speyk’ October 2001 - April 2003 Monthly Intertidal Bathymetries
The data (3) Mean : 57 m 57 m 0 m St.dev. : 29 m 16 m 25 m Variance : 838 m2 211 m2 (25%) 627 m2 (75%)
Results EOF analysis Example: MTL position (+0.2m contour) Variance explained by EOF1: 83.1% = beach nourishment
Reconstructed MTL position based on EOF1 only
Correlation between seasonal wave forcing and alongshore-averaged contour evolution
Correlation between seasonal wave forcing and amplitude evolution EOF 1
Correlation between seasonal wave forcing and beach width evolution
Conclusions At Egmond beach : • Position of the shoreline largely (75%) determined by positioning and amplitude of naturally occurring spatial patterns, rather than cross-shore movement of the beach as a whole • Beach nourishment incorporated in dominant spatial pattern (explaining 83% of spatial pattern variance) within months • Seasonality wave forcing of subordinate importance in observed beach evolution • Regarding prediction of beach evolution at seasonal scale we need to assess the relation between bar evolution and beach evolution (e.g. delayed beach response?).
Longshore position 29 42 Distance from RSP June 1999 Height (m) September 1999 March 2000
9 June 1999 5 October 1999 20 December 1999 15 March 2000
77 hours NNW-storm (315-330) 5 September 2001 11 September 2001
Variance explained by EOF1: 83.1% = beach nourishment
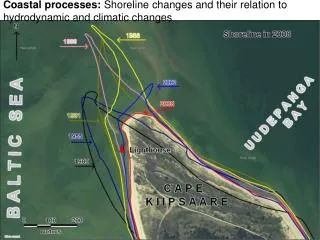
Conclusions Present case / in general: • Local problems (1-2 km, 1-5 years) can only be properly understood/tackled by involving larger scales (tens of kilometers/years) This uninterrupted coast (Egmond-Bergen): • 3D features important, also on a decadal timescale Local shallows (spacing 2km) on the breaker bar Interplay between bars and shore
Conclusions (continued) After the shoreface nourishment(s): • NW-storms straighten the bar/SW-storms induce crescentic shapes between the shallows (local shoreline: S-N oriented)
Conclusions (continued) • Shoreface/beach nourishment quite satisfactory in terms of CSI’s (4-5 years stead of 2 years) Negative side-effect probably could have been prevented Argus (with its high resolution) helpful : • At a local scale, and as a complementary instrument in studies of larger scales In the design of a new nourishment ?
10 October 2000 124 hours SW-storm 24 November 2000
12 SW-storm (30 hours) 14 December 2000 NW-storm (25 hours) 16
29 December 2001 22 February 2002 South 96 hours North 13 hours 24 February 2002 North 38 hours 28 February 2002 South 25 hours West 19 hours