Supply
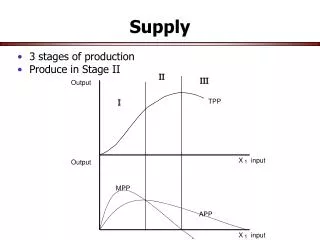
Economics Unit 4, Lesson 1. Supply. Objectives. Define supply. Explain the law of supply. Analyze the relationship between cost of production and cost that suppliers are willing to sell product. Construct a supply schedule and supply cure. Supply.

Supply
E N D
Presentation Transcript
Economics Unit 4, Lesson 1 Supply
Objectives • Define supply. • Explain the law of supply. • Analyze the relationship between cost of production and cost that suppliers are willing to sell product. • Construct a supply schedule and supply cure.
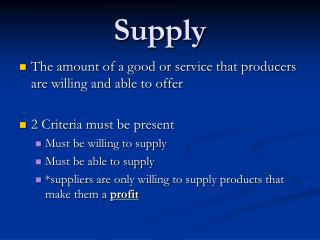
Supply • The amount that producers are willing and able to offer for sale at various prices.
Profit is what motivates producers so the higher the profit, the greater amount they will produce.
Law of Supply • As the price of an item goes up, the quantity supplied will increase; as the price of an item goes down, the quantity supplied will decrease. • P QS or P QS • Direct relationship between price and quantity supplied (QS) • Given production costs, a higher price means greater profits and an incentive for producers to increase quantity supplied.
Supply Schedule Price Quantity Supplied $ 5 50 $ 4 40 $ 3 30 $ 2 20 $ 1 10
Supply S
Market Supply Schedule Shows prices and total quantity supplied by all producers in the industry.
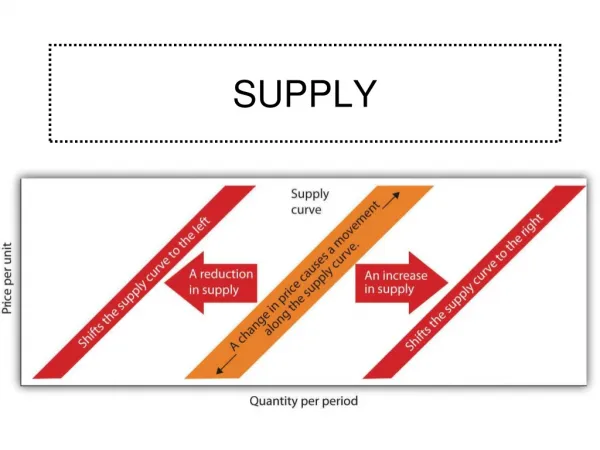
Change in QS Caused by a change in the price of the item. This is shown by a movement along the curve.
Change in QS P S1 P1 P2 Q2 Q1 Q
Change in Supply • If something other than the price changes, we call that a change in supply. • Our original supply curve is no longer valid, so we will shift the entire curve. • There are several reasons for a change in supply.
S2 S2 S1 $ $ S1 Q Q Decrease in Supply - Shift Left Increase in Supply - Shift Right
Change in Supply • Change in government regulations • Change in producer expectations • Change in taxes or subsidies • Change in # of sellers • Change in cost of inputs • Change in technology • Change in other goods’ price
1. Change in government regulations • Change in government regulations – This is when the government tells the producer they must do something. Example: Tells auto manufacturers they must have seat belts or air bags in all cars
2. Change in producer expectations 2. Change in producer expectations – This can be an expectation about price or some other factor that would influence the cost of production or the ability of the producer to produce the item. Example: If producers think the cost of one of their inputs may decrease in the future, they will wait to produce the item.
3. Change in taxes or subsidies 3. Change in taxes – This would be an excise tax on production. Taxes on producers raise the cost of production and cut into a producers profit, so a new tax will decrease supply. Change in subsidies – A subsidy is when the government pays the producer some money. This, in essence, lowers the cost of production and will cause an increase in supply.
4. Change in cost of inputs . Change in costs of inputs – An increase in the cost of inputs will cause profit to decrease so producers will supply less or shift left; a decrease in the cost of inputs means the producer will get more profit, and they will then increase supply or shift the curve right.
5. Change in technology 5. Change in technology – New technology allows a producer to lower the cost of production and will always shift the supply curve to the right with an increase.
6. Change in other goods’ prices • Change in prices of other goods- This is other goods that have the same productive process that a producer could produce. Example: If you are a farmer (producer) and you are producing wheat but you hear that the price of corn at market is going to be higher than wheat, you will stop producing wheat and start producing corn.
7. Change in # of sellers 7. Change in # of sellers – If more sellers or producers enter the market, supply will increase and shift right; if sellers leave the market for some reason, supply will decrease and shift left.