Download
1 / 6
60 likes | 214 Views
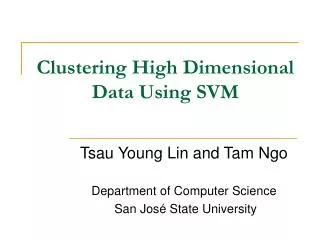
Star Coordinates : A Multi-dimensional Visualization Technique with Uniform Treatment of Dimensions Rohit Kelapure & David Tussedorf. Multi-dimensional Data Treats each dimension uniformly Follows the Info-Viz. Mantra : Overview First Zoom and Filter Details on Demand. Name.

E N D
Star Coordinates : A Multi-dimensional Visualization Technique with Uniform Treatment of DimensionsRohit Kelapure & David Tussedorf
Multi-dimensional Data Treats each dimension uniformly Follows the Info-Viz. Mantra : Overview First Zoom and Filter Details on Demand
Name Co-ordinate Axes on a Circle with equal Angles . Model-Year MPG Data-Points Scaled to Length of axis. Minimum Mapping : Origin Maximum mapping : Other end of Axis Cylinders Acceleration Star Co-ordinates : Curvilinear Co-ordinate System Displacement Weight Horsepower
Name- 1 Star Cartesian Model-Year-8 MPG - 2 d j3 d j2 d j4 ON(x,y) O(x,y) and sequence of N Two dimensional Vectors. An = <a1, a2, a3……. an > d j1 d j5 Accl.-7 Cylinders -3 p Calculation of data point location for an 8-dimensional dataset d j8 d j6 Data-element Dj Point Pj d j7 Displacement- 4 Weight -6 Horsepower – 5 Pj : Sum of all unit Vectors Ui = ( uxi , uyi )on each co-ordinate multiplied by the value of that data element for that co-ordinate
Transformations : Scaling Rotations Queries Applications : Hierarchially Clustered Datasets Multifactor Analysis