Download

1 / 24
240 likes | 428 Views
Need to Assimilate Sea Surface Height Anomalies into the Atmospheric Models. MM Ali NRSC (mmali73@yahoo.com). In this Presentation: Introduction to satellite altimetry SSHA and OHC OHC vs SST/SSHA Impact of SSHA on CI Impact of SSHA on CT SSHA → OMT ISMR vs SST/OMT Future.

E N D
Need to Assimilate Sea Surface Height Anomalies into the Atmospheric Models MM Ali NRSC (mmali73@yahoo.com)
In this Presentation: • Introduction to satellite altimetry • SSHA and OHC • OHC vs SST/SSHA • Impact of SSHA on CI • Impact of SSHA on CT • SSHA → OMT • ISMR vs SST/OMT • Future
Satellite Altimetry: How It Works? • Altimeter measures round-trip travel time, slope & strength of the return microwave radar pulse to determine distance to sea surface, significant wave height and wind speed. • Operates in Ku (13.8 GHz) & C (5.3 GHz) bands. • Principle of Altitude measurement is simple • D = Ct/2 • But many corrections have to be applied to obtain SSH.
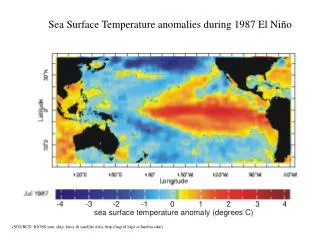
Atmosphere interacts with the upper ocean (due to the mixing processes) – not with SST alone • SST does not represent the upper ocean energy many times; but SSHA does • But, SST has been the only oceanographic input to the atmospheric models. • Having a priori information on subsurface thermal structure and SSHA OHC can be estimated • How to incorporate SSHA into the atmospheric numerical models? W C W C
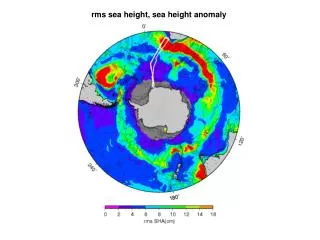
SPECIAL PUBLICATIONS NIO-NRSA-SP-01-03 Dynamic ht Vs SSH: 1 dyn cm = 1.02 cm (Inter relations btwn eddy prms?) SSH from altimeter & dyn ht. from CTD differs: i) SSH is wrt bottom; dyn ht. wrt a ref. level ii) Due to baroclinic effects below CTD ref. level iii) Due to barotropic signals not reflected by CTD signals (only altimeter can reflect)
1990-2005 = 15% reduction 72h lead time = 0% reduction 24h lead time 1970-2005 = 50% reduction 72h lead time Error reduction in track and intensity forecast (North Atlantic) = 30% reduction 24 hr lead time TC track predictionIntensity prediction
SHA (cm) during 10-19 May 2003 SHA (cm) during 01-10 May 2003 SST (oC) during 08-10 May 2003 (d) 10-19 May 2003 cyclone 10-19 May 2003 cyclone 10-19 May 2003 cyclone Latitude 28 29 30 31 32 >32 gap SHA (cm) during 06-15 Dec 2005 25 (e) 15-22 Dec 2005 Depression SHA Latitude -20 -12 -4 0 4 12 20 >20 gap • While cyclone induced mixing and evaporation cools SST and reduces intensity • theoretically, pre-existing warm features (eddies/MLD) provide heat energy. • Close relationship between CI & SSHA; but not with SST – for the same • atmospheric conditions. (EOS 2007)
Statistical analysis of SSHA and SST with cyclone intensity for North Indian Ocean Cyclones during 2005 to 2009 Negative/positive corr. ~ CI & SST : 23/32 CI &SSHA : 20/32
Percentage improvement of 2004-07 operational Ships (Atlantic) and STIPS (Pacific) forecasts by the inclusion of altimeter derived TCHP Goni et al. 2009: Oceanography
Katrina: Impact of TCHP on Sea Level Pressure Goni et al. 2009, Oceanography
6-11 May 2002 Arabian Sea Cyclone & SSHAs During 27 April – 06 May 2002 MM5 run with different SSTs (keeping other parameters same): Exp1: NCEP SST (MDE: 733 km)) Exp2: Const. SST of 300K Exp3: Three SST gradients at eddy locations (MDE: 513 km) Exp4: SSHA linearly converted to SST (MDE: 419 km) Compared to JTWC best track, Initial position errors same (large) for all experiments Displacement errors least for Exp4 A parameter representing subsurface thermal structure has to be integrated into the model. SSHA and tracks SST (NCEP) (C) Jointly with IIT-D (Nature Proceedings 2008: unrefereed) SST from SSHA
Fig 2(b) Observed : * * SSHA>SST : x x Control-Exp: o o Experiment 1: NCEP SST Experiment 2: SSHA converted SST Jointly with IIT-D
OMT from TCHP: TCHP from in situ observatons: (OMT-26)d 26 OMT = TCHP/d26/ +26 TCHP OMT
Validation of TCHP Daily RMSE : 20.6 kcal/cm2 R : 0.82 SI : 0.32 Monthly RMSE : 16.6 kcal/cm2 R : 0.87 SI : 0.25 IJRS: 2012
Impact of Ocean Mean Temperature on Cyclone Track: Nargis Track errors (km): Nargis NCEP SST • Track/landfall errors reduced by using OMT in place of NCEP SST • Impact more for large lead hours OMT Land fall errors: NCEP SST: 30 hrs OMT: 20 hrs
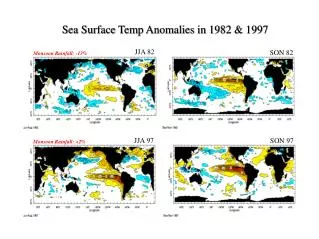
Correlation between OMT and SST with ISMR (1993-2010) OMT : Jan OMT: Feb IMD uses SST (-10 to -20 N; 100 to 120 E) for long range monsoon forecasting We found better correlation with OMT (-10 to 0 N; 50 to 70E) and all India summer monsoon rainfall SST: Feb SST: Mar OMT can be a better Parameter for long range Monsoon forecasting
Work ahead • Assess the role of the upper ocean thermal structure in the Arabian Sea and in the Bay of Bengal. • Is TCHP >>OMT the right parameter ? 3) Assess and validate temperature profiles of ocean numerical models, not just at the surface but also at the subsurface. For this we need ocean observations. 4) Assess temperature profiles obtained from purely statistical methods. 5) Support an ocean observing system for cyclone intensification studies, with satellite altimetry as the main platform for sustained observations. 6) Investigate if there is a link between TCHP trends and TC activity. 7) ASS the role of OMT in atmospheric models