Download
1 / 1
10 likes | 121 Views
This study introduces a nonparametric statistical approach for stereo correspondence analysis, utilizing permutation tests to compare optimization methods and set acceptance criteria. The method enhances the accuracy of disparity maps in stereo vision systems.

E N D
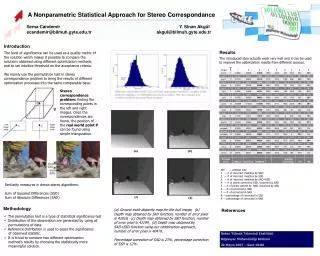
(a) (b) (c) (d) A Nonparametric Statistical Approach for Stereo Correspondance Sema Candemir Y. Sinan Akgül scandemir@bilmuh.gyte.edu.tr akgul@bilmuh.gyte.edu.tr Introduction Results The level of significance can be used as a quality metric ofthesolution which makes it possibleto compare the solutionsobtained usingdifferentoptimization methods, and to setintuitive thresholdon the acceptance criteria. We mainly use the permutation test in stereo correspondence problem to bring the results of different optimization processes into the same comparable base. The introduced ideaactually work very well and it can be used to improve the optimization results from different sources. Stereo correspondence problem:finding thecorresponding points in the left and right images.Once the correspondences arefound, the position of the real world point P can be found usingsimple triangulation. WS → window size 1 → # of incorrect matches by SAD 2 → # of incorrect matches by SSD → # of incorrect matches by SAD+SSD → # of pixels correct by SSD, incorrect by SAD 5 → # of pixels correct by SAD, incorrect by SSD 6 → # of corrected in SSD 7 → # of corrected in SAD 8 → percentage of corrected in SSD 9 → percentage of corrected in SAD Similarity measures in dense stereo algorithms: Sum of Squared Differences (SSD) Sum of Absolute Differences (SAD) Methodology (a) Ground truth disparity map for the bull image,(b) Depth map obtained by SAD function, number of error pixel is 41816,(c) Depth map obtained by SSD function, number of error pixelis 41199, (d)Depth map obtained by SAD+SSD function using ourcombination approach, number of error pixel is 40476. Percentagecorrection of SAD is 23%, percentage correction of SSD is 12%. References • The permutation test is a type of statistical significance test • Distribution of the observation are generated by using all permutations of data. • Reference distribution is used to asses the significance of observed statistic. • It is trivial to combine two different optimization method’s resultsby choosing the statistically more meaningful solution. Gebze Yüksek Teknoloji Enstitüsü Bilgisayar Mühendisliği Bölümü 20 Mayıs 2007 – Saat 10:00