Nonparametric Statistical Methods Overview & Examples
Explore nonparametric hypothesis tests, including Mann-Whitney, Kruskal-Wallis, Sign, Mood's Median, and more. Learn with Minitab examples and Dr. Joan Burtner’s guidance on statistical methods for different levels of data.

Nonparametric Statistical Methods Overview & Examples
E N D
Presentation Transcript
Nonparametric Statistical Methods: Overview and Examples IDM 404 ISE 482 Spring 2010 Dr. Joan Burtner
Four levels of data • Nominal • Categorical (Qualitative): Distinct Categories • North, South, East, West Bldg. 1, Bldg. 2, Bldg. 7 • Ordinal • Categorical (Qualitative): Characteristics that possess a logical order • 20/20, 20/30, 20/40 Small, Medium, Large H,M,L • Special cases • Likert Scales (1 2 3 4 5) or (1 2 3 4 5 6 7 8 9 10) • Discrete counted variables (number of calls, number of children, particle counts) • Interval • Continuous (Quantitative): value that can be measured • Differences between intervals have true meaning • No true zero • Scale • Continuous (Quantitative): value that can be measured • True zero Presented by Dr. Joan Burtner
Parametric Hypothesis Tests Assumption of a known distribution, typically the normal distribution Examples Single sample T-tests and Z-tests Two-sample T-tests and Z-tests Single-factor ANOVA Two-factor ANOVA Multi-factor ANOVA Factorial designs Presented by Dr. Joan Burtner
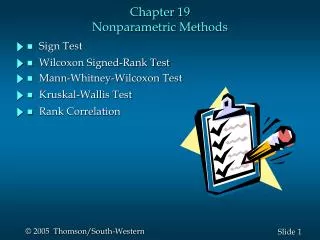
Non-parametric Hypothesis Tests No assumption of an underlying normal distribution in the population Other assumptions apply (eg. level of measurement) Examples (Since names vary by text and software package, you must look at calculation of test statistic and assumptions) Mann-Whitney Rank-Sum Signed Rank Kruskal-Wallis Sign Mood’s Median Friedman Median Test Presented by Dr. Joan Burtner
Minitab: Stat Menus Stat/Non-parametric Choose from seven non-parametric tests Names may be different from standard statistics texts Stat/Multivariate and Stat/DOE Stat/Tables One-way and Two-way Chi-Square Tests Not typically included in discussions of non-parametric statistical methods Stat/Basic Statistics Stat/ANOVA Stat/Regression Presented by Dr. Joan Burtner
Minitab: 1-Sample Sign Test Stat > Nonparametrics > 1-Sample Sign You can perform a 1-sample sign test of the median or calculate the corresponding point estimate and confidence interval. For the one-sample sign test, the hypotheses are H0: median = hypothesized median versus H1: median ≠ hypothesized median Use the sign test as a nonparametric alternative to 1-sample Z-tests and to 1-sample t-tests , which use the mean rather than the median. Presented by Dr. Joan Burtner
Minitab: 1-Sample Wilcoxon Stat > Nonparametrics > 1-Sample Wilcoxon You can perform a 1-sample Wilcoxon signed rank test of the median or calculate the corresponding point estimate and confidence interval. The Wilcoxon signed rank test hypotheses are H0: median = hypothesized median versus H1: median ≠ hypothesized median An assumption for the one-sample Wilcoxon test and confidence interval is that the data are a random sample from a continuous, symmetric population. Presented by Dr. Joan Burtner
Minitab: Mann-Whitney Test Stat > Nonparametrics > Mann-Whitney You can perform a 2-sample rank test (also called the Mann-Whitney test, or the two-sample Wilcoxon rank sum test) of the equality of two population medians, and calculate the corresponding point estimate and confidence interval. The hypotheses are H0: h1 = h2 versus H1: h1 ≠ h2 , where h is the population median. An assumption for the Mann-Whitney test is that the data are independent random samples from two populations that have the same shape and whose variances are equal and a scale that is continuous or ordinal (possesses natural ordering) if discrete. Presented by Dr. Joan Burtner
Minitab: Kruskal-Wallis Test Stat > Nonparametrics > Kruskal-Wallis You can perform a Kruskal-Wallis test of the equality of medians for two or more populations. This test is a generalization of the procedure used by the Mann-Whitney test and, like Mood's Median test, offers a nonparametric alternative to the one-way analysis of variance. The Kruskal-Wallis hypotheses are: H0: the population medians are all equal versus H1: the medians are not all equal An assumption for this test is that the samples from the different populations are independent random samples from continuous distributions, with the distributions having the same shape. Presented by Dr. Joan Burtner
Minitab: Friedman test Stat > Nonparametrics > Friedman Friedman test is a nonparametric analysis of a randomized block experiment, and thus provides an alternative to the Two-way analysis of variance. (according to Minitab) The hypotheses are: H0: all treatment effects are zero versus H1: not all treatment effects are zero Randomized block experiments are a generalization of paired experiments, and the Friedman test is a generalization of the paired sign test. Additivity (fit is sum of treatment and block effect) is not required for the test, but is required for the estimate of the treatment effects. Presented by Dr. Joan Burtner
Examples from Statistics Texts Rosner (Biomedical) Daniel (Biomedical) Walpole, Myers, Myers, and Ye (Engineering) Montgomery (Engineering) Montgomery and Runger (Engineering) Campbell, M. , Machin, D, and Walters, S. (Medical) Berenson and Levin (Business) Presented by Dr. Joan Burtner
Observations from Statistics Guides Minitab Help Minitab Statistics Guide SPSS Help Field, Andy (SPSS) Green, Salkind, and Akey (SPSS) Norman and Streiner (Comprehensive statistics text with a strong emphasis on explanations) Presented by Dr. Joan Burtner