Quality and SPC Tools: An Overview
800 likes | 1.21k Views
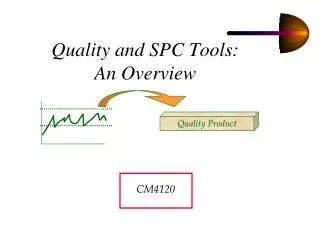
Quality and SPC Tools: An Overview. Quality Product. CM4120. Topics. Quality Advocates Quality Improvement Methodologies Six Sigma Quantitative Tools -Statistical Process Control (SPC) Tools. Process is “in control”?. Pause and Ponder?. What does “quality” mean?

Quality and SPC Tools: An Overview
E N D
Presentation Transcript
Quality and SPC Tools: An Overview Quality Product CM4120
Topics • Quality Advocates • Quality Improvement Methodologies • Six Sigma • Quantitative Tools -Statistical Process Control (SPC) Tools Process is “in control”?
Pause and Ponder? • What does “quality” mean? • Why is it important today? • How is the world changing? Anybody? Table Topic: Auto industry changes in the 1970’s!
Short Answers! • Quality = “..what the customer wants!” • Companies cutting costs! • Global competition!
Quality Advocates • People who proclaimed the importance of quality • Seven individuals dominant this area: • Each known for different subject area • All agree that quality is critical to the long term success of industries in today’s global environment!
Quality Basics • Quality (defined) • Characteristics of a product or service that bear on its ability to satisfy stated or implied needs • A product or service free of deficiencies • Customer determination • Only a customer can decide if and how well a product meets their needs, expectations, requirements
Ingredients for Success • Corporate Culture • Process Improvement • Variation • Productivity MINIMIZE! MAXIMIZE!
Corporate Culture • Companies seeking to remain globally competitive must integrate quality into their organization • Successful companies: • Focus on needs of the customer • Have a vision for the future/strategic plan • Clear vision allows for a common culture and value system focused on the customer • Teamwork and a result-oriented, problem-solving approach are mainstays in this environment
Process Improvement • Processes take inputs and perform value-added activities on those inputs to create an output • Simple Example (Choosing a movie!) • Input info (show times/places, whom you are going with, what you like) • Value-added activities (driving to theater, buying a ticket, watching movie) • Output (entertainment value of movie selected)
Process Improvement • Companies must seek out wasteful processes and improve them to remain competitive • Goals are: • 1 Prevent defects • 2 Increase productivity (reduce cycle time) • 3 Eliminate waste Producing quality goods in today’s manufacturing industry is mandatory!
Variation • Based on assumption that: • no two products (or occurrences) are exactly alike • variation is always present • Identified as difference between specified target value and the actual value obtained • Minimizing variation results in production of higher quality products
Variation • Specifications • State product characteristics in terms of a desired target value • Tolerance Limits • Show the permissible changes in the value of a quality characteristic • Processes must be stable (minimize variation) • Process is “under control” when variation or variability is stable and predictable
Productivity • Different from quality • Principal focus is on: • Working efficiently • Utilizing resources effectively • Examples: • Produce 10,000 units in 15 hours instead of 18 hours • However, must keep quality of products the same! Can you increase productivity while meeting quality standards set?
Evolution of Quality Artisan -> Inspection -> QC -> SQC -> SPC -> TQM -> Best Practices -> Future •Artisans produced goods and inspected •Inspection Activities -designed to detect or find nonconformances (defects) in existing products •Quality Control (QC) -goes beyond inspection -includes the use of specifications based on customer needs -Evaluating defects and taking action to prevent
SQC and SPC • Statistical Quality Control (SQC) • Includes statistical methods of product inspection and process monitoring • Statistical data is collected, analyzed, and interpreted to solve quality problems • Statistical Process Control (SPC) • Includes prevention of defects by applying statistical methods to control the process Similar to “P2 vs. End of Pipe Treatment!” SPC vs. SQC
SQC and SPC • Prevention refers to those activities designed to prevent defects • Major difference between prevention and inspection • Prevention - process is monitored • Inspection - products are monitored • SPC SEEKS TO LIMIT VARIATION!!! Note: Variation can result in shorter product life, less reliability, etc. for the customer!
SPC Advantages • Create products which consistently meet customer expectations, needs, etc. • Reduces variability allowing for predictions of future trends (experimentation is “doable”) • Minimize production costs • Eliminate scrap material, warranty work, etc. • Variation costs money!! • Allows for process monitoring Example: A pilot of plane needs to know where the plane is heading? Where it is? How high?
SPC Advantages (summarized) • Uniform output • Reduced rework • Fewer defective products • Increased profit • Lower average cost • Fewer errors • Less scrap • Increased job satisfaction • Factual information for decision making • Increased customer satisfaction And more!
Total Quality Management (TQM) • Management approach that places emphasis on: • Continuous process improvement • Achieving customer satisfaction • Ensuring long-term company success • Based on idea that commitment to quality MUST come from upper management! Similar to Safety! Must come from management!
Quality Advocates • Walter Shewhart • Worked at Bell Laboratories (1920’s-30’s) • Identified “controlled variation” and “uncontrolled variation” • First to encourage use of statistics to monitor processes • Put forth notion that a process “under control” is more predictable Developed formulas for creating X and R charts which will be discussed later!
Variation • Controlled Variation • Also called “common causes” • Variation due to nature of the process • Can only be removed by changing the process • Uncontrolled Variation • Also called “special causes” • Comes from sources external to process
Quality Advocates • Edwards Deming (1900-1993) • Encouraged top management to get involved • Worked with Japan following WWII • Preached that improving quality leads to: • Decrease costs • Improved productivity • Economic chain reactions (nationally) • Established Deming’s 14 points
Deming’s 14 points (highlighted) • Adopt a new philosophy company wide • Cease dependence on inspection • End practice of awarding business on basis of price alone • Break down barriers between departments • Eliminate work quotas • Institute programs for worker education and self-improvement • Institute leadership • Constantly strive to improve!
Deming’s Stages • Stage 1: Get process under control by identifying/eliminating special causes • Stage 2: Once process is stable, improve process by addressing common causes • Stage 3: Monitor process to determine if changes made are working
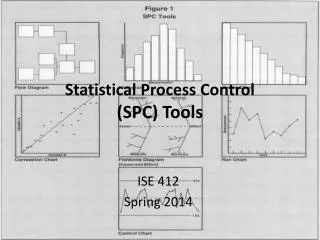
Kaoru Ishikawa • Encourage use of quality control tools including: • Check Sheets • Cause-and-Effect Diagrams (Fishbone!) • Flowcharts • Scatter Diagrams • Control Charts • Histograms • Pareto Charts Also called the “seven tools of quality”
Six Sigma • What is it? • Term used to indicate a process is well controlled i.e., +/- 3 sigma from the centerline in a control chart • Often associated with Motorola (named one of its key operational initiatives “Six Sigma Quality”) Made famous by GE (Jack Welch)!
Six Sigma • A management program? • (YES!) • Not primarily a technical program? • (YES!) • Technical proficiency indicated by a “belt system” (similar to Karate)? • (YES! Can you say Six Sigma Blackbelt?) Six Sigma Handbook is recommended! (See reference slide at end of presentation)
Six Sigma • Greenbelts • Intermediate levels of experience • Blackbelts • Advanced levels of experience Based on dollar amounts of projects completed, years of experience quality training, etc.
SPC TOOLS HERE! SPC TOOLS HERE!
TOOL 1 Check Sheets • “is a data recording device” Example: Automobiles arriving damaged Nonconformity Number Dented during shipping 3 Mechanical failure (engine) 12 Tires flattened 11 Windows broke 55 Missing molding 44
Check or Tally Sheets • Data (outdoor temperature, oF) • (for 24 hour period) • 55 II • 56 IIII IIII II • 57 IIII IIII • 58 IIII I • 59 III • 60 II Number of occurrences Temperature
Equipment Material Problem Environment Methods People Information Cause-and-Effect Diagrams“Fishbone Diagrams” TOOL 2 • “helps identify causes for nonconforming or defective products”
Cause-and-Effect DiagramsEXAMPLE! • Forklift tire replacement in a plant! Material Equipment Defective? Chemical Resistant? Hot? Tires replaced Frequently! Environment Wreckless? Training? Maintenance? People Methods Information
Flowcharts TOOL 3 • Graphical representation of all of the steps involved in an entire process or part of a process • Creating a flowchart • STEP 1 = Define process steps • STEP 2 = Sort steps in order of importance • STEP 3 = Place steps in “flow chart symbols” • STEP 4 = Evaluate steps for completeness What do the symbols look like?
Flowcharts storage operation Symbols typically used! inspection delay transportation decision
Data Collection • Pause and ponder • What about SPC tools which require data sampling? • Is sampling technique used important? • ANSWER = YES!!!!! YES!!!! YES!!!!
Populations vs. Samples • Population = “collection of all possible elements, values, or items associated with a situation” • Sample = “a subset of elements or measurements taken from a population” • Sample will represent the population ONLY if the sample is random (unbiased). NOTE: MORE DIFFICULT THAN IT SOUNDS!
Data Collection • Statistics-Types • 1.) Deductive = describe a population or complete group of data • 2.) Inductive = deal with a limited amount of data or a sample • Data Types • 1.) Variables Data = quality characteristics which can be measured • 2.) Attribute Data = quality characteristics which are present or absent, conforming or nonconforming Can use SPC tools with “attribute data”!
Data Analysis • Using statistics to define the location and spread • Location: • Central Tendency • Mean • Mode • Median • Spread: • Range • Standard Deviation Histograms at a glance! Let’s go to the board and discuss the basics!
TOOL 4 Scatter Diagrams • “graphical technique that is used to analyze the relationship between two different variables” Negative or positive correlation shown? Y (defects) X (processing time)
TOOL 4 Scatter Diagrams • “graphical technique that is used to analyze the relationship between two different variables” Negative or positive correlation shown? Y (defects) X (processing time)
TOOL 4 Scatter Diagrams • “graphical technique that is used to analyze the relationship between two different variables” No correlation shown! Y (defects) X (processing time)
Frequency Diagrams! 500 Frequency 300 100 Interval (classes) Histograms TOOL 5 • “graphical summary of the frequency of distribution of data”
Histograms • Very similar to Frequency Diagrams • Have cells with ranges of data/values • Cells often called “bins” ! • Constructing Histograms • Step 1: Collect data and make tally sheet • Step 2: Calculate the “range”(R) • (R = highest value - lowest value) • Step 3: Create cells (must choose number to create) Rules of Thumb : fewer than 100 pieces of data use 4 to 9 cells, 100 to 500 use 8 to 17 cells, more than 500 use 15 to 20 cells
Histograms • Constructing Histograms • Step 4: Label the Axes • Step 5: Post values (move from Tally Sheet to Histogram) • Step 6: Interpret the Histogram (look at shape!) • Shape? • Location? • Spread? Can tell you a lot! 500 Can make using ExcelTM! Frequency 300 100 Interval (classes)
Pareto Charts • Developed by “Pareto” • Vilfredo Pareto • Italian economist • Start with check or tally sheets • Used to develop the “80-20 rule” • 80% of dollars lost due to quality problems can be attributed to 20% of the quality problems!
Pareto Charts TOOL 6 • “graphical tool for ranking causes of problems from most significant to least significant” Frequency Diagrams! 300 Frequency 200 100 Problems (classes)