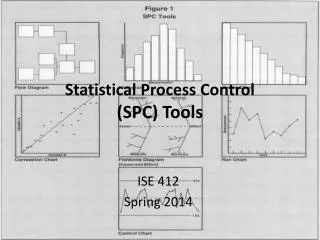
Statistical Process Control (SPC) Tools
Statistical Process Control (SPC) Tools. ISE 412 Spring 2014. Why do we need SPC tools?. We need Quality! With SPC, the process is monitored through sampling. Considering the results of the sample, we can prevent or improve the our week point in production lines. What do SPC tools monitor?.

Statistical Process Control (SPC) Tools
E N D
Presentation Transcript
Statistical Process Control(SPC) Tools ISE 412 Spring 2014 ISE 412 Spring 2014
Why do we need SPC tools? • We need Quality! • With SPC, the process is monitored through sampling. • Considering the results of the sample, we can prevent or improve the our week point in production lines. ISE 412 Spring 2014
What do SPC tools monitor? Process variability • Random • common causes • inherent in a process • can be eliminated only through improvements in the system • No-Random • special causes • due to identifiable factors • can be modified through operator or management action ISE 412 Spring 2014
What are SPC tools? • Histogram • Check Sheet • Pareto Chart • Cause and Effect Diagram • Defect Concentration Diagram • Scatter Diagram • Control Chart • … ISE 412 Spring 2014
What are SPC tools? • Histogram Example 1 ISE 412 Spring 2014
What are SPC tools? • Check Sheet ISE 412 Spring 2014
What are SPC tools? • Pareto Chart Example 2 ISE 412 Spring 2014
What are SPC tools? • Cause and Effect Diagram (example3) ISE 412 Spring 2014
What are SPC tools? • Defect Concentration Diagram ISE 412 Spring 2014
What are SPC tools? • Scatter Diagram (example4) ISE 412 Spring 2014
Control Chart 35 30 UCL=28.0 Number of Errors 25 20 Avg=16.0 15 10 5 LCL=4.0 0 5 10 15 20 Week What are SPC tools? • Control Charts! ISE 412 Spring 2014
Why Control Charts? ISE 412 Spring 2014
What kinds of Control Charts do we have? • Attribute • a product characteristic that can be evaluated with a discrete response • good – bad; yes – no • Variable • a product characteristic that is continuous and can be measured • weight - length Fraction nonconforming (P-chart) # nonconforming per inspection (C-chart) Range (R-chart) Mean (x bar-chart) Variability (S-chart) ISE 412 Spring 2014
Application of Control Charts • Outlier • Run • Trend • Cyclicity ISE 412 Spring 2014
Process Capability Analysis • Process capability is the ability of the process to meet the design specifications for a service or product. • Nominal value is a target for design specifications. • Tolerance is an allowance above or below the nominal value. ISE 412 Spring 2014
Process Capability Analysis ISE 412 Spring 2014
Nominal value Lower Limit Upper Limit 20 25 30 Process Capability Analysis • Specification Limits • Control Limits • Natural Tolerance Limits Example 5 = = /c4 or /d2 ISE 412 Spring 2014
Upper specification - Lower specification 6 Cp = Process Capability Ratios • Process Capability Ratio, Cp: the tolerance width divided by 6 standard deviations (process variability). Example 5 ISE 412 Spring 2014
Process Capability Ratios • One-side Process Capability Ratio: Example 5 ISE 412 Spring 2014
Nominal value Lower Limit Upper Limit 20 25 30 Process Capability Ratios ISE 412 Spring 2014
Process Capability Ratios Cp value could not indicate the proper process capability if the process is not centered since Cp does not account for where the process mean is with respect to the specifications. To alleviate this issue, another process capability index, Cpk is used: Cpk=min(Cpu,Cpl) ISE 412 Spring 2014
Cp Vs Cpk ISE 412 Spring 2014
Summary SPC tools: Histogram, Check Sheet, Pareto Chart, Cause and Effect Diagram, Defect Concentration Diagram, Scatter Diagram, Control Chart, And so more Capability Ratios: ISE 412 Spring 2014