Download
1 / 15
150 likes | 228 Views
This study examines the impacts of municipal conservation and reuse strategies in Region C to reduce water demand and postpone the need for additional water supplies. By 2030, Region C aims to fulfill 33% of its municipal water demand through such measures. The study analyzes Gallons per Capita per Day (GPCD) as a key metric for water use, considering influences such as commuter populations. It evaluates current progress and projected goals for GPCD, highlighting the potential contributions of conservation and reuse strategies to meeting future municipal water needs in Region C.

E N D
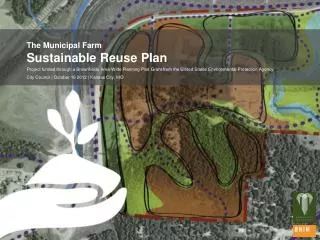
Impacts of Municipal Conservation and Reuse Strategies in Region C Dan Hardin Director, Water Resource Planning Texas Water Development Board
Senate Bill 3 “The Study Commission shall:” (3) determine whether water demand in the Region C Regional Water Planning Area may be reduced through additional conservation and reuse measures so as to postpone the need for additional water supplies
By 2030, Region C expects to meet 33% of its municipal demand through conservation and reuse strategies.
Gallons per capita per day • Measure of municipal water use, defined as the average daily total of residential plus commercial plus institutional water use, divided by total resident population. • Water is used at home and at place of work. • In 2007: Dallas San Antonio Total GPCD 240 150 Residential GPCD 92 86
Influences on Gallons per capita per day • All other things equal, GPCD will be higher in regions/cities where the daytime population is augmented by commuters who live in a different region/city. • Dallas adds 290,000 net commuters on a daily basis (23% of the population), San Antonio adds less than 50,000 (3.8% of the population) • In the western counties of Region D (Delta, Hopkins, Hunt, Lamar, Rains, Van Zandt, Wood), 22% of the total workforce commuted to a job in Region C (2006 data).
P 133 D 141 L 149 H 157 I 160 M 164 B 165 N 165 K 168 O 172 G 174 E 176 F 198 C 203 J 205 A 214 Planning Regions ranked by Municipal GPCD, 2000
Current Progress Toward GPCD Goals Region C Region D Estimated GPCD, 2000 203 141 Projected GPCD, 2010 (after conservation & reuse) 171 139 Actual GPCD, 2007 172 150
P 123 L 127 E 128 K 129 D 134 C 136 H 137 M 142 I 146 G 154 N 155 O 156 B 157 A 169 F 171 J 176 Planning Regions ranked by Municipal GPCD, 2030 (after savings from conservation and reuse strategies)
Is More Conservation Enough? • Would additional conservation by Region C be sufficient to eliminate all municipal needs? • Needs – Projected water demands in excess of existing supplies that would be physically and legally available during a repeat of the drought of record.
Contribution of Conservation and Reuse to Region C Municipal Needs
What Part of Remaining Needs Could be Met if Region C GPCD was Equal to Region D GPCD? • 2030 – 13.5% • 2040 – 9.8% • 2050 – 13.1% • 2060 – 16.5% Even if Region C’s GPCD were reduced to the same level as Region D, there would be remaining unmet municipal needs in Region C of nearly 750,000 acre-feet in 2060.