Download
1 / 29
290 likes | 455 Views
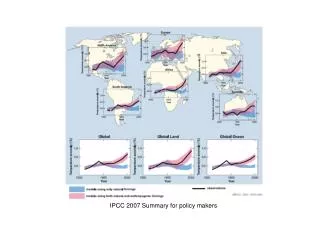
Impact of climate change on the global oceanic sink of CO 2 Corinne Le Quéré, University of East Anglia and British Antarctic Survey. winds. decadal changes in the earth’s physical system. energy. water. observed warming trend 1979-2005. Smith and Reynolds 2005 and IPCC 2007.

E N D
Impact of climate change on the global oceanic sink of CO2Corinne Le Quéré,University of East Anglia and British Antarctic Survey
winds decadal changes in the earth’s physical system energy water observed warming trend 1979-2005 Smith and Reynolds 2005 and IPCC 2007
2000-2005 CO2 budget (GtC/y) atmosphere 4.2 fossil fuel emissions land use change land sink 7.2 1.5 2.3 ocean sink 2.2 geological reservoirs Global Carbon Project, Canadell et al. 2007
decadal trend in the Airborne Fraction atm CO2 CO2 emissions (FF + Land Use) gain of 0.053 (p = 0.89) Airborne fraction 1960 1970 1980 1990 2000 time Canadell et al. 2007, PNAS
2000-2005 CO2 budget (GtC/y) atmosphere 4.2 fossil fuel emissions land use change land sink 7.2 1.5 2.3 ocean sink 2.2 geological reservoirs Global Carbon Project, Canadell et al. 2007
biological activity physical transport atmosphere CO2 chemical reactions ocean
Alert (Canada) Mauna Loa observatory (Hawaii) Palmer (Antarctica)
Alert (Canada) atmospheric CO2 Palmer (Antarctica) time (y)
Alert (Canada) atmospheric CO2 Palmer (Antarctica)
Atmospheric Inverse Model: Cmeasured↔ Cmodeled = Af +co model and approach: Christian Rödenbeck
change in Southern Ocean CO2 sink expected trend CO2 sink (PgC/y) Le Quéré, Rödenbeck, Buitenhuis et al. 2007
trend in oceanic pCO2 1981-2007 (uatm/y) 2.8 1.6 0.4 data from Takahashi et al., DSR (2008) Feely et al., 2006, Schuster and Watson, 2007, Takahashi et al., 2006 deseasonalised observations, evenly distributed over 3 decades longest data series from: Richard Feely, Cathy E. Cosca, Rik Wanninkhof, David W. Chipman, Colm Sweeney, Andrew Watson, Dorothee C. E. Bakker, Ute Schuster, H. Yoshikawa-Inoue, Masao Ishii and T. Modorikawa, Y. Nojiri, Jon Olafsson, C. S. Wong., Arne Kroetzinger, Bronte Tilbrook, Truls Johannessen and Are Olsen.
trend in oceanic pCO2 1981-2007 (uatm/y) 2.8 1.6 0.4 data from Takahashi et al., DSR (2008) Feely et al., 2006, Schuster and Watson, 2007, Takahashi et al., 2006 deseasonalised observations, evenly distributed over 3 decades longest data series from: Richard Feely, Cathy E. Cosca, Rik Wanninkhof, David W. Chipman, Colm Sweeney, Andrew Watson, Dorothee C. E. Bakker, Ute Schuster, H. Yoshikawa-Inoue, Masao Ishii and T. Modorikawa, Y. Nojiri, Jon Olafsson, C. S. Wong., Arne Kroetzinger, Bronte Tilbrook, Truls Johannessen and Are Olsen.
identifying the processes with the OPA model • OPA General Circulation model • 0.5-1.5ox2o resolution • 31 vertical levels • calculated vertical mixing • NCEP daily forcing • PISCES-T ecosystem model • 2 phyto, 2 zoo., 2 sinking particles • limitation by Fe, P, and Si • initialise with observations in 1948 • (Buitenhuis et al., GBC 2006)
Trends +1°C +0.4 m/s 1982-2007 SST 1988-2007 winds Obs NCEP NCEP2 updated from Reynolds and Smith (1994) SSMI winds (Wentz et al 2007)
Trends in ocean pCO2 (uatm/y) Obs CO2 only Le Quéré, Takahashi, Buitenhuis, Rödenbeck & Sutherland, in prep.
Trends in ocean pCO2 (uatm/y) Obs NCEP CO2 and climate NCEP2 Le Quéré, Takahashi, Buitenhuis, Rödenbeck & Sutherland, in prep.
change in Global Ocean CO2 sink CO2 only CO2 sink (PgC/y) CO2 and climate Time (y) Le Quéré, Takahashi, Buitenhuis, Rödenbeck & Sutherland, in prep.
Trend in ocean CO2 sink (PgC/y per decade, 1981-2007) difference of 0.20 PgC/y per decade Le Quéré, Takahashi, Buitenhuis, Rödenbeck & Sutherland, in prep.
identifying the processes with the OPA model • OPA General Circulation model • 0.5-1.5ox2o resolution • 31 vertical levels • calculated vertical mixing • NCEP daily forcing • PISCES-T ecosystem model • 2 phyto, 2 zoo., 2 sinking particles • limitation by Fe, P, and Si • initialise with observations in 1948 • (Buitenhuis et al., GBC 2006) • no T effect on CO2 • constant fluxes Le Quéré, Takahashi, Buitenhuis, Rödenbeck & Sutherland, in prep.
Trend in ocean CO2 sink (PgC/y per decade, 1981-2007) ~50% of recent trends in ocean CO2 sink can be attributed to human activities Le Quéré, Takahashi, Buitenhuis, Rödenbeck & Sutherland, in prep.
the Airborne Fraction atm CO2 CO2 emissions (FF + Land Use) Airborne fraction (p = 0.89) 1960 1970 1980 1990 2000 time Canadell et al. 2007, PNAS trend in airborne fraction: 0.07 PgC/y per decade trend in ocean CO2 sink from climate (since 1981): 0.20 PgC/y per decade
modelled change in carbon storage (μmol/L) 1000 depth (m) 2000 3000 4000
modelled change in surface pH 0 -0.05 1000 depth (m) 2000 3000 4000
1981-2004 conditions human CO2 emissions higher winds causes CO2 outgassing Csurface = 2120 Cdeep = 2260 deep ocean 35ºS 65ºS
conditions under very high atmospheric CO2 human CO2 emissions higher winds causes CO2 uptake Csurface > 2260 Cdeep = 2260 deep ocean 65ºS 35ºS
>100 years after CO2 emissions stop higher winds causes CO2 outgassing Csurface = 2120 + C Cdeep = 2260 + C deep ocean 65ºS 35ºS
fossil fuel CO2 emissions for the world Raupach et al., 2007