Download

1 / 34
340 likes | 677 Views
Modeling the Ebola Outbreak in West Africa, 2014. August 4 th Update Bryan Lewis PhD, MPH ( blewis@vbi.vt.edu ) Caitlin Rivers MPH, Stephen Eubank PhD, Madhav Marathe PhD, and Chris Barrett PhD. Overview. Epidemiological Update Country by country analysis

E N D
Modeling the Ebola Outbreak in West Africa, 2014 August 4th Update Bryan Lewis PhD, MPH (blewis@vbi.vt.edu) Caitlin Rivers MPH, Stephen Eubank PhD, MadhavMarathe PhD, and Chris Barrett PhD
Overview • Epidemiological Update • Country by country analysis • Details from Liberian outbreak • Compartmental Model • Description • Comparisons with different disease parameters • Long term projections • Preliminary back of envelope look at US
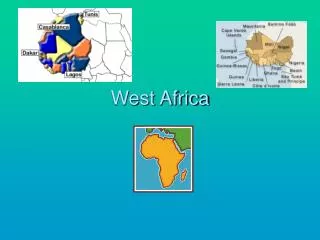
Epidemiological Update • Confirmed case imported into Lagos via air travel – 59 contacts being monitored, but many others are lost to followup • Outbreak in Guinea has picked up again • Two new areas of Liberia are reporting cases • 83 new cases in Sierra Leone from July 20-27 • 2 American Health workers now cases • One in Atlanta being treated
Epidemiological Update • Data reported by WHO on July 31 for cases as of July 27 • Sierra Leone case counts censored up to 4/30/14. • Time series was filled in with missing dates, and case counts were interpolated.
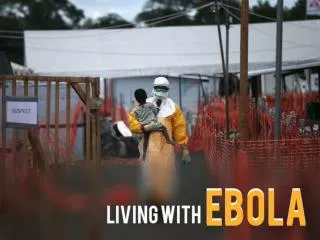
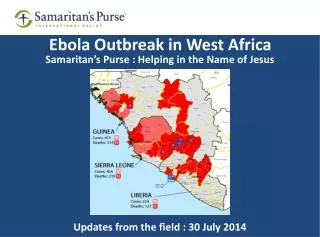
Liberia • Major ports of entry are now closed • Two previously unaffected counties are investigating suspected cases • Continued transmission via funerary practices still suspected • Transmission among healthcare workers continued • Significant resistance in the community, particularly Lofa county. Patients are concealed, refuse follow up, buried secretly.
Detailed data from Liberia • Healthcare work infections and contact tracing info captured • More details than aggregates could help with estimates
Sierra Leone • 83 new cases were reported between July 20 and 27, a massive increase. • Sierra Leone now has the most cases of the three affected countries • A confirmed patient left isolation in the capital city, reportedly due to “fear and mistrust of health workers”
Guinea • Worrying spike in cases from July 20-27 reporting period, after a prolonged lull. • WHO asserts this suggests “undetected chains of transmission existed in the community”
Compartmental Approach • Extension of model proposed by Legrand et al. Legrand, J, R F Grais, P Y Boelle, A J Valleron, and A Flahault. “Understanding the Dynamics of Ebola Epidemics” Epidemiology and Infection 135 (4). 2007. Cambridge University Press: 610–21. doi:10.1017/S0950268806007217.
Legrand et al. Approach • Behavioral changes to reduce transmissibilities at specified days • Stochastic implementation fit to two historical outbreaks • Kikwit, DRC, 1995 • Gulu, Uganda, 2000 • Finds two different “types” of outbreaks • Community vs. Funeral driven outbreaks
NDSSL Extensions to Legrand Model • Multiple stages of behavioral change possible during this prolonged outbreak • Optimization of fit through automated method • Experiment: • Explore “degree” of fit using the two different outbreak types for each country in current outbreak
Optimized Fit Process • Parameters to explored selected • Diag_rate, beta_I, beta_H, beta_F, gamma_I, gamma_D, gamma_F, gamma_H • Initial values based on two historical outbreak • Optimization routine • Runs model with various permutations of parameters • Output compared to observed case count • Algorithm chooses combinations that minimize the difference between observed case counts and model outputs, selects “best” one
Fitted Model Caveats • Assumptions: • Behavioral changes effect each transmission route similarly • Mixing occurs differently for each of the three compartments but uniformly within • These models are likely “overfitted” • Guided by knowledge of the outbreak to keep parameters plausible • Structure of the model is published and defensible • Many combos of parameters will fit the same curve
Guinea Fitted Model In progress This outbreak is difficult to fit, with so many seeming behavioral shifts
Liberia Fitted Models Assuming no impact from ongoing response and DRC parameter fit is correct: 83 cases in next 14 days Assuming no impact from ongoing response and Uganda parameter fit is correct: 63 cases in next 14 days
Liberia Fitted Models Model Parameters No behavioral Changes included
Liberia Fitted Models Sources of Infections
Sierra Leone Fitted Model Assuming no impact from ongoing response and DRC parameter fit is correct: 101 cases in next 14 days Assuming no impact from ongoing response and Uganda parameter fit is correct: 107 cases in next 14 days
Sierra Leone Fitted Model Model Parameters No behavioral Changes included
Sierra Leone Fitted Models Sources of Infections DRC R0 estimates rI: 1.40278302774 rH: 2.85436942329e-10 rF: 0.151864780392 Overall: 1.55464780842 Uganda R0 estimates rI: 0.424081180257 rH: 6.70236711791e-10 rF: 1.4124823235 Overall: 1.83656350443
Model Fitting Conclusions • Given: • Many sets of parameters can yield “reasonable” fits with totally different transmission drivers • These different parameter sets offer similar estimated projections of future cases • Coarseness of the case counts and inability to estimate under/over case ascertainment • Can not account for all uncertainty, thus estimates are very uncertain: • Model structure and parameters allow for over-fitting • Not enough information in current case count curve to limit this uncertainty • Need more information to characterize the type of outbreak
Notional Long-term Projections • Start with “best” fit model (example purposes: Sierra Leone model fit from Uganda params) • Induce behavioral change in 2 weeks that bends epidemic over such that it ends at 6m, 12m, 18m • Estimate impact • Example: Sierra Leone @ 6m • Cases: ~900 more
Notional US estimates • Under assumption that Ebola case, arrives and doesn’t seek care and avoids detection throughout illness • CNIMS based simulations • Agent-based models of populations with realistic social networks, built up from high resolution census, activity, and location data • Assume: • Reduced transmission routes in US
Notional US estimates Approach • Get disease parameters from fitted model in West Africa • Put into CNIMS platform • ISIS simulation GUI • Modify to represent US • Example Experiment: • 100 replicates • One case introduction into Washington DC • Simulate for 3 weeks
Notional US estimates Example 100 replicates Mean of 1.8 cases Max of 6 cases Majority only one initial case
Next steps • Seek data to choose most appropriate model • Detailed Liberia MoH with HCW data • Parse news reports to estimate main drivers of transmission • Patch modeling with flows between regions from road networks • Refine estimates for US • Find more information on characteristics of disease, explore parameter ranges • Gather more data for West African region
Patch Modeling Combines compartmental models with Niche modeling to explore larger scale dynamics. Can help understand
Population Construction - Global New Focus
Pop Construction – New Countries Liberia: • Limited demographic information • http://www.tlcafrica.com/lisgis/lisgis.htm • http://www.nationmaster.com/country-info/profiles/Liberia/People • OpenStreetMap data (OSM data file is 4.1 MB, so limited) • http://download.geofabrik.de/africa.html Sierra Leone: • Some demographic information • http://www.statistics.sl • http://www.nationmaster.com/country-info/profiles/Sierra-Leone/People • http://www.statistics.sl/reports_to_publish_2010/population_profile_of_sierra_leone_2010.pdf • OpenStreetMap data (OSM data file is 10.2 MB) Guinea: • Some demographic information • http://www.stat-guinee.org (french) • http://www.nationmaster.com/country-info/profiles/Guinea/People • OpenStreetMap data (OSMdata file is 15.6 MB)
Conclusions • Still need more data • Working on gathering West Africa population and movement data • News reports and official data sources need to be analyzed to better understand the major drivers of infection • From available data and in the absence of significant mitigation outbreak in Africa looks to continue to produce significant numbers of cases • Expert opinion and preliminary simulations support limited spread in US context