Download

1 / 31
310 likes | 642 Views
Modeling the Ebola Outbreak in West Africa, 2014. Sept 2 nd Update Bryan Lewis PhD, MPH ( blewis@vbi.vt.edu ) Caitlin Rivers MPH, Eric Lofgren PhD, James Schlitt , Katie Dunphy , Stephen Eubank PhD, Madhav Marathe PhD, and Chris Barrett PhD. Currently Used WHO Data.

E N D
Modeling the Ebola Outbreak in West Africa, 2014 Sept 2nd Update Bryan Lewis PhD, MPH (blewis@vbi.vt.edu) Caitlin Rivers MPH, Eric Lofgren PhD, James Schlitt, Katie Dunphy, Stephen Eubank PhD, MadhavMarathe PhD, and Chris Barrett PhD
Currently Used WHO Data • Data reported by WHO on Aug 29 for cases as of Aug 26 • Sierra Leone case counts censored up to 4/30/14. • Time series was filled in with missing dates, and case counts were interpolated.
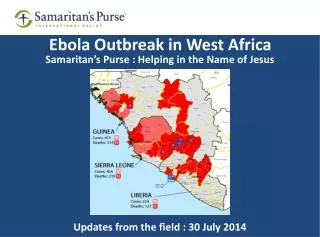
Epi Notes • Case identified in Senegal • Guinean student, sought care in Dakar, identified and quarantined though did not report exposure to Ebola, thus HCWs were exposed. BBC • Liberian HCWs survival credited to Zmapp • Dr. SengaOmeonga and physician assistant KyndaKobbah were discharged from a Liberian treatment center on Saturday after recovering from the virus, according to the World Health Organization. CNN
Epi Notes • Guinea riot in Nzerekore (2nd city) on Aug 29 • Market area “disinfected,” angry residents attack HCW and hospital, “Ebola is a lie” BBC • India quarantines 6 “high-risk” Ebola suspects on Monday in New Delhi • Among 181 passengers who arrived in India from the affected western African countries HealthMap
Further evidence of endemic Ebola • 1985 manuscript finds ~13% sero-prevalence of Ebola in remote Liberia • Paired control study: Half from epilepsy patients and half from healthy volunteers • Geographic and social group sub-analysis shows all affected ~equally
Twitter Tracking Most common images: Risk map, lab work (britain), joke cartoon, EBV rally
Liberia Forecasts rI: 0.95 rH: 0.65 rF: 0.61 R0 total: 2.22 Model Parameters 'alpha':1/12, 'beta_I':0.17950, 'beta_H':0.062036, 'beta_F':0.489256, 'gamma_h':0.308899, 'gamma_d':0.075121, 'gamma_I':0.050000, 'gamma_f':0.496443, 'delta_1':.5, 'delta_2':.5, 'dx':0.510845
Liberia Vaccinations 20% of population Vaccinated on Nov 1st and Jan 1st Additional Infections Prevented (by April 2015): Nov 1st - ~275k Jan 1st - ~225k
New model for Liberia • Due to continued underestimation, have refit model • Small increases in betas change the fit compared to “stable” fit of last 3 weeks • May shift to this model for future forecasts
Sierra Leone Epi Details • asdfsdf By Sierra Leone MoH has 1077 cases (vs. 1026 as reported by WHO)
Sierra Leone Forecasts rI:0.85 rH:0.74 rF:0.31 R0 total: 1.90 Model Parameters 'alpha':1/10 'beta_I':0.164121 'beta_H':0.048990 'beta_F':.16 'gamma_h':0.296 'gamma_d':0.044827 'gamma_I':0.055 'gamma_f':0.25 'delta_1':.55 delta_2':.55 'dx':0.58
Sierra Leone Vaccinations 100k on Nov 1st 200k on Jan 1st Additional Infections prevented (by April 2015) Nov 1st - ~6k Jan 1st - ~7.5k
All Countries Forecasts rI:0.85 rH:0.74 rF:0.31 Overal:1.90
All Countries Vaccinations • Need more than just vaccine to interupt transmission 100k on Nov 1st 200k on Jan 1st Additional Infections prevented (by April 2015) Nov 1st - ~3.2k Jan 1st - ~4.0k
Extracting the Guinea experience • Result: Not enough information in early slight decrease to harvest meaningful impacts. • Model won’t fit well • Conclusion: Likely need to wait another week or so to assess impacts of recent new push on interventions to incorporate their impact
Long-term Operational Estimates • Based on forced bend through extreme reduction in transmission coefficients, no evidence to support bends at these points • Long term projections are unstable
Next Steps • Detailed HCW infection analysis underway • Looking at exposure and infections in Liberia to assess the attrition rates of HCW under current conditions • Initial version of Sierra Leone constructed • Initial look at sublocation modeling required a re-adjustment • Should start simulations this week • Build similar versions for other affected countries
Next steps • Publications • One submitted, another in the works • 2 quick communications in prep • Problems appropriate for agent-based approach • Logistical questions surrounding delivery and use of medical supplies • Effects of limited HCW both direct and indirect • Synthetic outbreaks to compare to what we’ve observed of this one, to estimate true size
Supporting material describing model structure, and previous results Appendix
Legrand et al. Model Description Legrand, J, R F Grais, P Y Boelle, A J Valleron, and A Flahault. “Understanding the Dynamics of Ebola Epidemics” Epidemiology and Infection 135 (4). 2007. Cambridge University Press: 610–21. doi:10.1017/S0950268806007217.
Compartmental Model • Extension of model proposed by Legrand et al. Legrand, J, R F Grais, P Y Boelle, A J Valleron, and A Flahault. “Understanding the Dynamics of Ebola Epidemics” Epidemiology and Infection 135 (4). 2007. Cambridge University Press: 610–21. doi:10.1017/S0950268806007217.
Legrand et al. Approach • Behavioral changes to reduce transmissibilities at specified days • Stochastic implementation fit to two historical outbreaks • Kikwit, DRC, 1995 • Gulu, Uganda, 2000 • Finds two different “types” of outbreaks • Community vs. Funeral driven outbreaks
NDSSL Extensions to Legrand Model • Multiple stages of behavioral change possible during this prolonged outbreak • Optimization of fit through automated method • Experiment: • Explore “degree” of fit using the two different outbreak types for each country in current outbreak
Optimized Fit Process • Parameters to explored selected • Diag_rate, beta_I, beta_H, beta_F, gamma_I, gamma_D, gamma_F, gamma_H • Initial values based on two historical outbreak • Optimization routine • Runs model with various permutations of parameters • Output compared to observed case count • Algorithm chooses combinations that minimize the difference between observed case counts and model outputs, selects “best” one
Fitted Model Caveats • Assumptions: • Behavioral changes effect each transmission route similarly • Mixing occurs differently for each of the three compartments but uniformly within • These models are likely “overfitted” • Many combos of parameters will fit the same curve • Guided by knowledge of the outbreak and additional data sources to keep parameters plausible • Structure of the model is supported
Notional US estimates Approach • Get disease parameters from fitted model in West Africa • Put into CNIMS platform • ISIS simulation GUI • Modify to represent US • Example Experiment: • 100 replicates • One case introduction into Washington DC • Simulate for 3 weeks
Notional US estimates Assumptions • Under assumption that Ebola case, arrives and doesn’t seek care and avoids detection throughout illness • CNIMS based simulations • Agent-based models of populations with realistic social networks, built up from high resolution census, activity, and location data • Assume: • Transmission calibrated to R0 of 3.5 if transmission is like flu • Reduced transmission Ebola 70% less likely to infect in home and 95% less likely to infect outside of home than respiratory illness
Notional US estimates Example 100 replicates Mean of 1.8 cases Max of 6 cases Majority only one initial case