PRESENTATION OUTLINE
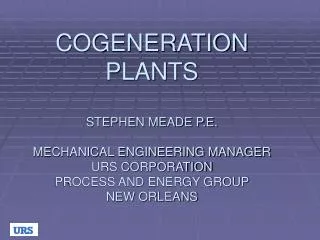
COGENERATION PLANTS STEPHEN MEADE P.E. MECHANICAL ENGINEERING MANAGER URS CORPORATION PROCESS AND ENERGY GROUP NEW ORLEANS. PRESENTATION OUTLINE. 1. INTRODUCTION 2. DEFINITION OF COGENERATION 3. ELECTRIC POWER GENERATION SYSTEMS 4. TYPES OF COGENERATION SYSTEMS

PRESENTATION OUTLINE
E N D
Presentation Transcript
COGENERATION PLANTSSTEPHEN MEADE P.E.MECHANICAL ENGINEERING MANAGERURS CORPORATIONPROCESS AND ENERGY GROUPNEW ORLEANS
PRESENTATION OUTLINE 1. INTRODUCTION 2. DEFINITION OF COGENERATION 3. ELECTRIC POWER GENERATION SYSTEMS 4. TYPES OF COGENERATION SYSTEMS 5. TYPES OF COGENERATION EQUIPMENT 6. UTILITY RATE STRUCTURES 7. COGENERATION ECONOMIC FEASIBILITY 8. APPLICATION EXAMPLES
INTRODUCTION TO COGENERATIONPOWER PLANTS WHEN A PROCESS PLANT USES STEAM OR REQUIRES A HEAT SOURCE: Opportunity Exists For Cogeneration (Typically Electricity and Steam) Benefit is: Increased System Thermal Efficiencies
DEFINITION OF COGENERATION • Generation of Electric (or Mechanical) Power & HEAT – Steam, Hot Water or Hot Oil • Topping Cycle – Electric power is generated and waste heat is used in the process. • Bottoming Cycle – Electric power is generated from recovery from excess thermal energy from kilns, process heaters, furnaces and process with exothermic reaction.
ELECTRIC POWER GENERATION SYSTEMS LARGE CENTRAL POWER PLANTS DISTRIBUTIVE POWER PLANT (LOCAL) COGENERATION POWER PLANTS GREEN CONCEPT POWER PLANTS
TYPES OF Energy ProductionPOWER PLANTS Per Unit Typical Size • SOLAR CELLS AND WIND TURBINES 0.75 to 3 MW • HYDROELECTRIC ALL SIZES • RECIPROCATING ENGINES 0.25 to 10 MW • GAS TURBINES x to 250 MW • COMBINED CYCLE 50 to 375 MW • NG/OIL FIRED BOILERS WITH STEAM TURBINES40 to 800 MW • COAL FIRED BOILERS WITH STEAM TURBINES 100 to 1,000 MW • NUCLEAR 800 to 1,200 MW (* MW is a million Watts)
Per KW OF INSTALLEDCAPACITY COSTS OF POWER PLANTS • WAS $1,200 / KW - NOW ?? • $800 TO $1,200 / KW • $400 to $600 / KW • $400 to $500 / KW • $260 to $800 / KW • $100 to $400 / KW • ?? • $3000 / KW ?? • NUCLEAR • COAL FIRED BOILERS WITH STEAM TURBINES • NG/OIL FIRED BOILERS WITH STEAM TURBINES • GAS TURBINES • COMBINED CYCLE • RECIPROCATING ENGINES • HYDROELECTRIC • SOLAR CELLS AND WIND TURBINES
COSTS OF FUELS • NUCLEAR • $0.17 TO $0.50 / MM Btu • NATURAL GAS • $8.23 / MM Btu (avg. value in 2005) • OIL • Distillate Oil • $13.56 / MM Btu (as of 7/25/2006) • Residual Oil • $8.44 / MM Btu (as of 7/25/2006) • COAL • $.75 TO $1.50 / MM Btu • OTHER FUELS
Diesel Engine Driven Generator – 1 MW 35% Simple Cycle Gas Turbine Engine Driven Generator – 5 MW 26% Simple Cycle High Efficiency Gas Turbine - 45 MW 38% Small Utility Gas Fired Boiler / Steam Turbine / Generator – 50 MW 28% Large Utility Gas Fired Boiler/ Steam Turbine / Generator – 500 MW 34% Large Utility Coal Fired Boiler/ Steam Turbine / Generator – 800 MW 36% 83.5 MW Gas Turbine With HRSG In Combined Cycle With 43.7 MW Steam Turbine 50% 171 MW Gas Turbine With Triple Pressure HRSG In Combined Cycle With 95 MW Steam Turbine 56% Electric Power Generating Equipment Configuration Approximate Thermal EfficiencyBased on HHV
Fired Steam and Hot Oil Generating Equipment Configuration Approximate Thermal EfficiencyBased on HHV Gas or Oil Fired Boiler With Economizer and Air Preheat 86% Package Gas Fired Boiler 200,000 # / hr steam 84% Hot Oil Heater With Convective Section 85% • Add combustion air preheat 87%
Combustion Turbine With Heat Recovery Equipment Approximate Thermal EfficiencyBased On HHV • 5 MW Gas Turbine With HRSG – no supplemental firing 25,000 # / hr sat steam 81 % • 45 MW Gas Turbine With HRSG – no supplemental firing 225,000 # / hr sat steam 85% • 85 MW Gas Turbine With HRSG – no supplemental firing 400,000 # / hr sat steam 74% • 85 MW Gas Turbine With HRSG – w / supplemental firing 800,000 # / hr sat steam 65%
FUEL REQUIREMENTS • HEAT RATE= HEATING VALUE of FUEL x FUEL FLOWRATE Btu GENERATOR POWER OUTPUT in 1 hr KW-hr If the units are the same heat rate would be overall system efficiency
Diesel Engine Driven Generator – 1 MW 9725 Simple Cycle Gas Turbine Engine Driven Generator – 5 MW 12400 Simple Cycle High Efficiency Gas Turbine - 45 MW 8997 Small Utility Gas Fired Boiler / Steam Turbine / Generator – 50 MW 12000 Large Utility Gas Fired Boiler/ Steam Turbine / Generator – 500 MW 10000 Large Utility Coal Fired Boiler/ Steam Turbine / Generator – 800 MW 9400 83.5 MW Gas Turbine With HRSG In Combined Cycle With 43.7 MW Steam Turbine 6800 171 MW Gas Turbine With Triple Pressure HRSG In Combined Cycle With 95 MW Steam Turbine 6090 Electric Power Generating Equipment Configuration Approximate Heat RatesBtu / kW h Based on HHV
HHV vs LHV • HIGHER HEATING VALUE (HHV) • Also Known As Gross HV • LOWER HEATING VALUE (LHV) • Also Known As Net HV • (Not The Same As Heat Rate Net and Gross)
HHV vs LHV(CON’T) HHV vs LHV Natural Gas 1040 vs 938 Btu / SCF- 10% Fuel Oil 138 vs 130 k Btu / gal – 6% Coal 12 vs 11.6 k Btu / lb – 3%
POWER PLANTTHERMODYNAMIC CYCLES • RANKINE CYCLE: STEAM • BRAYTON CYCLE: COMBUSTION GAS TURBINES • OTTO CYCLE: SPARK IGNITION RECIPROCATING ENGINE • DIESEL CYCLE: COMPRESSION IGNITION RECIPROCATING ENGINE
GAS TURBINE POWER PLANTS • TYPES • Aeroderivatives • Frame Machines • PLANT CONFIGURATIONS • Simple Cycle • Combined Cycle • Cogeneration
COMBINED CYCLEPOWER PLANTS • Brayton and Rankine Cycles • Fire Natural Gas or Distillate In Gas Turbine (Brayton Cycle) To Generate Electricity • Recover The Exhaust Heat - Heat Recovery Steam Generator (HRSG) • Use Generated Steam In a Steam Turbine (Rankine Cycle) To Generate Electricity • Efficiency Range Of 50% To 58%
TYPES OF COGENERATION SYSTEMS • Boilers with Back Pressure Steam Turbine - with LP steam used in a process • Diesel Reciprocating – hot water or LP steam used in a process • Natural Gas Reciprocating - hot water or LP steam used in a process • Combustion Turbines - with waste heat used to generate Steam, hot oil or water which is used in a process • Combustion Turbines - with waste heat used to generate Steam for use in a process with excess steam going to a condensing steam turbine to make electricity
TYPES OF COGENERATION EQUIPMENT • Boilers With Back Pressure Steam Turbines • Fluidized Bed Boilers • Inexpensive Fuel – bark, black liquor, TDF, cross ties, wood chips, compost • Gas Fired Boilers • Typically packaged >150 k#/hr, by rail, 300 k#/hr by barge and any size - field erected • Natural gas, Hydrogen, CO, Waste Refinery Gas • Large LPS heat load • Back Pressure Steam Turbine − driving an electric generator with LPS used in the process
TYPES OF COGENERATION EQUIPMENT (CON’T) • Diesel Reciprocating Engine − driving an electric generator with heat recovery from the exhaust or cooling water for relative low temperature heat loads (typically hot water production) • Gas Reciprocating Spark Ignition Engine
TYPES OF COGENERATION EQUIPMENT(CON’T II) • Combustion Turbines With Heat Recovery • Fuels – hydrogen, carbon monoxide, waste refinery gas, natural gas, distillate oil, heavy oil
TURBINE NAMEPLATECAPACITY RATING • ISO CONDITIONS • 59°F Ambient Temperature • 60% Relative Humidity • 0 Feet Elevation • No Inlet or Exhaust Pressure Losses
CONTROLLING PERFORMANCE FACTORS • AMBIENT TEMPERATURE • 10% Capacity loss in 30o F • ELEVATION • 4% Capacity loss in 1000 ft • PRESSURE LOSSES • .75% / inch of pressure loss
SOURCES OF PRESSURE LOSS • INLET PRESSURE LOSSES • Inlet air filter • Inlet air chiller • EXHAUST PRESSURE LOSSES • Exhaust silencer/stack • Heat recovery steam generator • SCR – Selective catalyst reduction • CO catalyst
GAS TURBINE PLANT PERFORMANCE ENHANCEMENTS • WATER INJECTION • STEAM INJECTION • INLET AIR COOLING • Evaporative coolers • Foggers • Inlet air chillers • FUEL HEATERS
HEAT RECOVERY UNITS • Turbine exhaust temperatures vary with the machines between: • 750 F High efficiency (recuperative machines) or 875 F (high compression ratio aeroderivative machines) to • 1050 F CT’s with 12 : 1 compression ratios to • 1250 F low efficiency (typically older model) machines
HEAT RECOVERY UNITS (CON’T) • HOT OIL UNITS • PROCESS FEED OIL UNITS • HOT WATER UNITS
HEAT RECOVERY STEAM GENERATORS (HRSG) • Typical single pressure HRSG (with Steam Drum or Once Through) • Two or three pressure HRSG’s with superheaters, reheaters and economizers • HRSG can also be supplementary fired – usually with natural gas to take advantage of the 1000 F 15% oxygen in the exhaust • Use same basic design to raise the temperature up to between 1450 and 1650 F • Higher temperatures become more economical with water wall tube designs – looks like a packaged boiler without a wind box and burner. • As you continue to consume the oxygen, then the design must change again to require air registers to mix the fuel and air. Typically not done – adds BP to turbine
UTILITY RATE STRUCTURES • Utility Power Industry Description • Investor Owned Regulated Utility Companies • Government Operated Regulated Utilities • Municipalities • Electric Co-operatives • IPP-Independent Power Producers
UTILITY RATE STRUCTURES (CON’T) • Rates have three parts: • Fixed Costs • Operating • Fuel Fuel is 70% of the cost of a power plant operation
UTILITY RATE STRUCTURES (CON’T II) • Customer Charge • Demand Charge $ / kW • SAP (Supplemental Additional Power) $/kW • Energy Charges $ / kWh • Fuel Adjustment $ / kWh • Facilities Charges
COGENERATION ECONOMIC FEASIBILITY Fuel Chargeable to Power Heat rate based on backing out the thermal load = fuel burned (Btu/hr)- heat recovered(Btu/Hr) kW h • Roughly, 4200 Btu/kW h
COGENERATION FEASIBILITYCAPITAL COST • Electric Power System Upgrades and Steam Generation Equipment Vs • CogenerationPlant Equipment and Installation