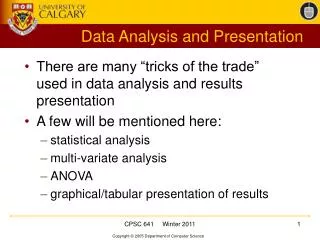
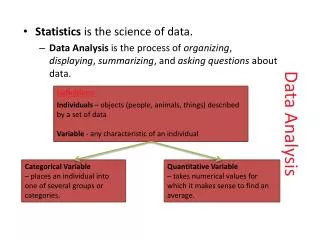
Exploring Data Analysis Methods for Statistical Interpretation
This comprehensive guide defines and breaks down various statistical methods including descriptive statistics, inferential statistics, parametric tests, and non-parametric tests. Learn the essentials of data analysis and interpretation techniques.

Exploring Data Analysis Methods for Statistical Interpretation
E N D
Presentation Transcript
Descriptive Statistics • Descriptive (describe) • Frequencies • Percents • Measures of Central Tendency • mean • median • mode
Measures of Spread • Range • Nominal data = number of responses in each category (A’s = 4, B’s = 7, C’s = 21, D’s = 1, F’s=2) • Other data = difference between responses for the greatest and least numeric values (Age of oldest is 104 and youngest is 18. Range =86 years) • Tertiles, Quartiles, Quintiles • Interquartile Range (IQR) • Range for the 25th to 75th percentiles which captures the middle 50%
Measures of Spread • Standard Deviation – describes, on average, how much individual values differ from the mean • Standard Scores or Z-scores – describes how many SD’s away from the sample mean an individual score or response is
Normal Distribution 68% of individuals 95% of individuals >99% of individuals Sample Mean -3 SD -2 SD -1 SD +1 SD +2 SD +3 SD
Inferential Statistics(Comparative) • Based on Probability • Tests of significance: are observed differences real differences or simply the result of chance • t-test: test difference between means of two groups (t statistic) • ANOVA (Analysis of Variance): test difference among three of more independent groups (F statistic)
Interpreting p-values or probability value • Used to decide whether the results observed are likely to reflect real differences between groups • The standard is to use α = 0.05 or 5% (1 in20) • t = 1.11, p =0.042 • t = 1.02, p = 0.051 • Probability that results observed have occurred by chance alone • α = probability of Type I error (finding statistical significance when in reality there is none)
Significance • Statistical • Practical • Clinical
Parametric and Non-Parametric • Parametric = DV is some measured quantity (ratio or interval) so it makes sense to calculate means and SD • You can draw bell curves through the data defined by two parameters…the mean and SD….hence parametric (beside, near) • Non-Parametric = DV is count or rankings so means and SD have no meaning (e.g. The average religion of Americans is 2.67)
Parametric Tests • T-tests • ANOVA (analysis of variance) • Linear Regression or Multiple Linear Regression • ANCOVA (analysis of covariance) – combines regression and analysis of variance
Non-Parametric Tests • Chi-square • Logistic Regression • Log-linear analysis