Download
1 / 52
520 likes | 683 Views
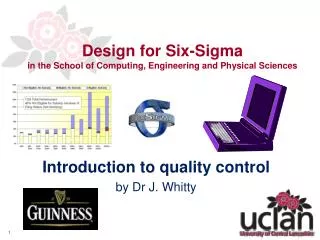
Design for Six-Sigma in the School of Computing, Engineering and Physical Sciences. Introduction to quality control by Dr J. Whitty. Lessons structure. The lessons will in general be subdivided in to eight number of parts, viz.: Statement of learning objectives Points of orders

E N D
Design for Six-Sigmain the School of Computing, Engineering and Physical Sciences Introduction to quality control by Dr J. Whitty
Lessons structure • The lessons will in general be subdivided in to eight number of parts, viz.: • Statement of learning objectives • Points of orders • Introductory material (Nomenclature) • Concept introduction (Statistical measures) • Development of related principles (Control charts) • Concrete principle examples via – reinforcement examination type exercises • Summary and feedback • Formative assessment, via homework task
Learning Objectives Distinguish between Quality control and Quality assurance from a statistical viewpoint Evaluate the central tendency and dispersion of realistic operational business data Use a test statistics to formulate quality control decisions Describe high-quality and hence six-sigma from a quantitative viewpoint After the session the students should be able to:
Nomenclature and Terminology Quality – the percentage of items that conform to an agreed design specification. QC/A Control and Assurance CV control value U/LCL – Upper/Lower Control Limit Sigma – One standard deviation Poka-Yoke – mistake-proofing Statistical Quality Control (SQC) techniques are used to measure the conformance of components and services
Learning check Generally during product manufacture which of the following incur the greatest costs (1). Direct Labour Fixed Overheads Material Costs Is MRP a push or pull process (2) Other than fixed name three other generic process-layouts (3) Based on our previous work you should now be able to answer the following short answer examination type questions.
Measures of the central tendency • Mode • The maximum value of the distribution e.g. the most occurring value (in reality this can be evaluated using a standard formula • Median • The central value of a set of data or a distribution. Can be evaluated using a standard method of using the CDF • Arithmetic mean • The central value assuming the data are distributed in accordance to an arithmetic progression • Geometric mean • The central value assuming the data are distributed according to a geometric progression • Others (Harmonic-mean, Trimmonic-mean)
The mode • For our data this occurs between 30-39 (the modal range) • The construction shown can be employed to home in on the exact value • Or the formula: where L=lower boundary, l=lower freq diff, u=upper freq diff & c=the class boundary width
The Median • For our data we could evaluate this quantity two fold • Approximate using by plotting the cumulative frequency diagram • Via logical inference
NOTE: Measures of Dispersion • The range • Largest value minus Smallest value • Variance • Mean Square variation from the mean • Standard Deviation • Square root of the variance
Decision Processes • This is all very well and good however, how does this allow us to make research and managerial & research decisions? • To answer this we need to consider the pattern of the data, thus:
The Normal distribution • Many sets of data adhere to the normal distribution. • The most important distribution of them all • It is pretty much this property that allows us to obtain (research) management decisions • The normal distribution is usually written N(μ,σ2); with μ the population mean and σ2 the variance
Properties of N(μ,σ2) • For any normal curve with mean mu and standard deviation sigma: • 68 percent of the observations fall within one standard deviation sigma of the mean. • 95 percent of observation fall within 2 standard deviations. • 99.7 percent of observations fall within 3 standard deviations of the mean.
Exercise • Example: Using a z score If a population is N(111,33.82), find the probability that some value of 100 <X<150.
Exercise • Using a z score and given that the population is N(37,4.352), find the probability that some value of X>150.
Samples • If we are using a sample of values as a consequence of the central limit theorem the z score will change, thus
Example • The mean expenditure per customer at a tire store is £60 and the sd £6. It is known that the nominal customer per day is 40. A new product costs £64, what is the probability of selling such a product per customer
Try one • In a store, the average number of shoppers is 448, with an sd of 21. What is the probability that 49 shopping hours have a mean between 441 and 446.
Process Variables • In essence the mean and standard deviations are Statistical Process Variables which can be employed to find out if a process or system is operating within established control limits Upper (UCL): Lower (LCL): Control (CV):
Class discussion • Using our knowledge of the normal distribution decided on appropriate values of dU,L.. Hence evaluate the process UCL and LCL for the process with means of 33.8, 33.8 33.6 33.7 33.8.33.9 and 33.2. • Discuss methods of obtaining measures of normality
Class Discussion… • Using the hand-out of the distribution tables provided examine the following points… • In reality a number of samples are taken in order to ensure that natural random variation is eliminated from the process and hence quality controls. • Discuss methods the use of the normal distribution for samples of low numbers. In particular what would you expect to happen the control limit values. • How doe the choice of distribution affect the quality. • Bearing in mind the central-limit theorem we discussed in the Math how can be remove random variation from samples.
The t-distribution… • Due to the reasons we have just outlined the general tool used in-order to determine the upper and lower deviation limits is the Student’s (actually Gossett) t-distribution. As this is actually a family of distributions each being function of the degrees-of-freedom. And hence the size of the samples!
Control limits • In the analysis of a certain CNC milling operation the following data are obtained from a systematic random sampling process of 12 components. • Evaluate the process control value • The UCL and LCL. • Discuss the minimum advisable design tolerances which can be produced by the machine.
Class example • Data are obtained from process times of health and safety inspection times, a systematic random sampling of15 different tests. • Evaluate the process control value • The UCL and LCL. • Discuss the minimum advisable waiting time which should be quoted for the inspection.
Control charts • These are of upmost importance in not only recommending to design engineers specific tolerance limits for a specific process but also for designs which push-the-envelope of both product (and services). That is, the development of the so called Yoka-Yoke operations. For operations with continuous process variables. The x-bar and R charts are usually of most use.
Condition monitoring • Since this is an introductory (first-year) course. You will only ever be asked to evaluate control limits and describe how the charts are plotted. • In addition, you may be requested to describe how such charts can be used for condition-monitoring, in particular, the following features: • Two-points in the danger area (4-sigma) • Four-to-five points above/below the CV • Trends (Positive/negative/cyclic)
Short: Examination type questions • Give the technical term of mistake-proofing. (1) • Write down a formula linking the design and process tolerances. (1) • Define QC and QA. (2) • What distribution should be used to evaluate the control limits if the sample-size is less than 30. (2) • State three principal prohibitive quality costs (3)
Six Sigma • The precise definition of Six Sigma is not important (at this stage but we will look at this in detail later in the lecture – or even next week); the content of the program is • A disciplined quantitative approach for improvement of defined metrics • Can be applied to all business processes, manufacturing, finance and services
Focus of Six Sigma* • Accelerating fast breakthrough performance • Significant financial results in 4-8 months • Ensuring Six Sigma is an extension of the Corporate culture, not the program of the month • Results first, then culture change! *Adapted from Zinkgraf (1999), Sigma Breakthrough Technologies Inc., Austin, TX.
Six Sigma: Reasons for Success • The Success at Motorola, GE and AlliedSignal has been attributed to: • Strong leadership (Jack Welch, Larry Bossidy and Bob Galvin personally involved) • Initial focus on operations • Aggressive project selection (potential savings in cost of poor quality > $50,000/year) • Training the right people
The right way! • Plan for “quick wins” • Find good initial projects - fast wins • Establish resource structure • Make sure you know where it is • Publicise success • Often and continually - blow that trumpet • Embed the skills • Everyone owns successes
Why Six-Sigma works • Consider the 99% quality level • 5000 incorrect surgical operations per week! • 200,000 wrong drug prescriptions per year! • 2 crash landings at most major airports each day! • 20,000 lost articles of mail per hour! • These are NOT satisfactory • Companies should strive for ‘Six Sigma’ quality levels • A successful Six Sigma programme can measure and improve quality levels across all areas within a company to achieve ‘world class’ status • Six Sigma is a continuous improvementcycle
Not very satisfactory! • Companies should strive for ‘Six Sigma’ quality levels • A successful Six Sigma programme can measure and improve quality levels across all areas within a company to achieve ‘world class’ status • Six Sigma is a continuous improvementcycle
Improvement cycle • PDCA cycle Plan Act Do Check
Alternative interpretation Prioritise (D) Measure (M) Hold gains (C) Interpret (D/M/A) Improve (I) Problem (D/M/A) solve
Statistical background Some Key measure Target = m
Statistical background ‘Control’ limits + / - 3 s Target = m
Statistical background Required Tolerance U S L L S L + / - 3 s Target = m
Statistical background Tolerance U S L L S L + / - 3 s Target = m + / - 6 s Six-Sigma
Statistical background Tolerance U S L L S L + / - 3 s 1 3 5 0 1 3 5 0 p p m p p m Target = m + / - 6 s
Statistical background Tolerance U S L L S L + / - 3 s 1 3 5 0 1 3 5 0 p p m p p m 0 . 0 0 1 0 . 0 0 1 p p m p p m Target = m + / - 6 s
Statistical background • Six-Sigma allows for un-foreseen ‘problems’ and longer term issues when calculating failure error or re-work rates • Allows for a process ‘shift’ • Thus the distributions described ealier almost always operate within design tolerances. • Even when the envelope is pushed this has less of an effect on quality
Statistical background Tolerance U S L L S L 1 . 5 s 3 . 4 6 6 8 0 3 p p m p p m 0 p p m 3 . 4 p p m m + / - 6 s
Performance Standards PPM Yield 2 3 4 5 6 308537 66807 6210 233 3.4 69.1% 93.3% 99.38% 99.977% 99.9997% Current standard World Class Process performance Defects per million Long term yield
Performance standards First Time Yield in multiple stage process Number of processes 3σ 4σ 5σ 6σ 1 10 100 500 1000 2000 2955 93.32 50.09 0.1 0 0 0 0 99.379 93.96 53.64 4.44 0.2 0 0 99.9767 99.77 97.70 89.02 79.24 62.75 50.27 99.99966 99.9966 99.966 99.83 99.66 99.32 99.0
Financial Aspects Benefits of 6s approach w.r.t. financials
Summary Have we met out learning objectives? Specifically are you able to: • Distinguish between Quality control and Quality assurance from a statistical viewpoint • Evaluate the central tendency and dispersion of realistic operational business data • Use a test statistics to formulate quality control decisions • Describe high-quality and hence six-sigma from a quantitative viewpoint
Examination type questions • Statistical process control has been used in the manufacturing industry since the 1980s to improve the quality of engineered components • Define high-quality from a quantitative viewpoint (4) • With reference to the answer in part (a) how does quality differ from reliability (6). • During a drilling operation an inspector records the following sizes from a standard slot drill, 10.01, 10.03, 10.04, 10.01, 10.04, 10.06. Estimate a suitable process tolerance assuming that the measurements are normally distributed. (8 ………..
Examination type questioncontinued • Assuming that there is no reason to believe that the values can be taken as process mean values, with ranges of, 0.05, 0.02, 0.02, 0.02, 0.03, 0.04, calculate: • The process CV. (2) • The UCL and LCL (9) • The minimal allowable design tolerance for the process, giving reasons for you answer. (5) • *Describe how design packages such as ANSYS and MATLAB can be employed to facilitate six-sigma methodologies (6) *This is this weeks research task
Summary Have we met out learning objectives? Specifically are you able to: • Distinguish between Quality control and Quality assurance from a statistical viewpoint • Evaluate the central tendency and dispersion of realistic operational business data • Use a test statistics to formulate quality control decisions • Describe high-quality and hence six-sigma from a quantitative viewpoint