
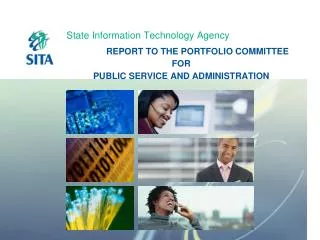
State Information Technology Agency
This annual report presentation to the PSA Portfolio Committee outlines the strategic objectives and achievements of the State Information Technology Agency (SITA) for 2008-2009. Highlights include improved service delivery, operational efficiency, financial sustainability, and the implementation of key integrated service programs. The report emphasizes the importance of optimizing revenue streams, leveraging assets, and building leadership competencies to ensure that ICT effectively serves South African citizens. Key challenges and future objectives are also discussed.

State Information Technology Agency
E N D
Presentation Transcript
State Information Technology Agency 2008/9 Annual Report Presentation to (PSA) Portfolio Committee
Agenda • Strategic Objectives : Achievements • Key Integrated Service Provision Programs • Human Capital • Financial Performance OPERATIONAL EFFICIENCY CUSTOMER & STAKEHOLDER SATISFACTION • FINANCIAL • SUSTAINABILITY IMPROVED SERVICES
Ensuring that ICT works for the Citizens Improve Long-Term Financial Sustainability Results for South Africa Financial Responsibility Optimise Revenue Streams Leverage Assets optimally (people & resources) Optimise Working Capital Improve Cost Structure Financial Be a Trusted Advisor E- Innovation SITA Process Excellence Service Excellence Modernise Public Service Operations Reduce Government Cost of Doing Business Optimise ICT Infrastructure Services Improve Responsiveness Consistently Meet Service Levels Customer By Leveraging Industry Partnerships we will Improve Service Level Management Extend Service Footprint Maximise Efficiency of Processes Improve the Management of Service Portfolio Internal Process Standardise & Automate Process Encourage Innovation Culture Understand Customers‘ Business & Needs Build Leadership & Management Competencies Improve Accountability Embed SITA Culture & Values Develop Skills Attract & Retain Talent. Learning & Growth
Achievements: Strategic Objectives Objectives/Target Set as per 2008/9 SITA Corporate Score Card: Achieved = 19 Not Achieved = 8 Categories for Objectives: Financial = 4 Objectives with 5 set targets Customer = 10 Objectives with 10 set targets Internal Processes = 4 Objectives with 5 set targets Learning and Growth = 5 Objectives with 7 set targets
Achievements: Strategic Objectives • Objectives achieved: • Grow revenue base • Develop and implement an integrated, consistent and robust planning cycle regime • Develop detailed service catalogue and service metrics • Quality of service sample • Develop and implement the service offerings to local government using Shared Services model • Improve quality of revenue and reduce costs to customers for agency transactions • IFMS ( Integrated Financial Management System) • Develop and implement ICT Planning Governance Framework • E-Gov
Achievements: Strategic Objectives • Objectives achieved (continued): • GWEA ( Government Wide Enterprise Architecture) • Quality improvement – including implementation of an IT Service Management Framework • Improve business processes • Develop skills ( Identified Core and Critical Skills) • Focus on embedding SITA organizational values to ensure they are instilled in the way we work • Attract and retain critical skills and best performers • Develop and implement an Integrated Talent Management Strategy • Attainment of employment equity: EE and Disability
Achievements: Strategic Objectives • Objectives not achieved • Achieve working capital and cash flow targets • Develop, implement and maintain competitive costing and sustainable pricing strategies (commercial models) • Convert all licensed software with a significant share of total government ownership to a single enterprise license • Signing of Service Level Agreements • Clean Audit Report • Implement procurement-specific interventions to improve operational excellence • Attainment of employment equity targets: Gender
Key Integrated Service Provision Programs Government Programmatic Support • Local Government Support Program (Municipal ICT blueprint) The Local Government Support programme is an initiative designed for the purpose of identifying solutions, testing the concepts applicable to identified local government requirements with the intention of implementing these solutions in municipalities. • Electronic Health record The objective of the Electronic Health Record project (e-HR.Za) is to design and develop a solution for an Electronic Health record for South Africa that will allow the Department of Health (DoH) to have a single view of patient information across the country. • SAPS and DoD These are outsourced ICT accounts that SITA manages on behalf of these clients. • Education: Lurits The National Education Department has identified the need to design and implement a national learner unit record information and tracking system (LURITS). The LURITS is a web-based system that will enable the DoE to store the unit record level data of learners and educators in a central national database and will enable the Department to track the movement of learners from school to school throughout their school career. • Poverty Index This initiative is intended to help in the validation of information of people applying for indigent grants. • IEC Call Centre (and now Presidential Hotline) These initiatives showcase how optimization of existing ICT infrastructure can reduce the life cycle costs of solutions to government. • Youth Development Programme (Youth Internship Programme) This programme offers unemployed diplomates and graduants an opportunity to enter into the ICT world through a year long internship programme.
Key Integrated Service Provision Programs • Modernizing Government Systems • Government-wide Enterprise Architecture (GWEA) • The value of this framework would empower government ICT entities to: align their ICT plans and capabilities with departmental business plans and capabilities; to make informed decisions pertaining ICT investment, acquisition and development; to identify and reduce duplication of ICT; to improve security and interoperability among government information systems. • Next Generation Network (NGN) The asset provides new capability to offer fully converged communications network that offers functionality such as data, voice and video transmission in a defines quality of service framework. • Network Operations Centre (NOC) This asset enables SITA to proactively monitor the NGN to minimize network outages that may negatively affect service delivery. • Integrated Financial Management System (IFMS) The purpose of the IFMS project is to consolidate, integrate and upgrade Government’s out-dated legacy transversal I.T. systems in order to meet new legislative and organisational requirements, introduce cost-effective technologies, eliminate duplication, support e-Government initiatives and contribute to broader socio-economic objectives such as contributing to skills development and stimulating the domestic ICT industry, particularly BEE and SMME companies. • Next Generation e-Government Establish an e-Government platform that is central, scalable, flexible, extensible, reliable, customizable, and integrated on which online services can be delivered to citizens/business/foreigners, etc. • Implementation of Free Open Source Software (FOSS) • This initiative is intended to deliver numerous outcomes among which are to (1) develop skills for FOSS (research showed this was the key problem) (2) Promote open standards and open source (3) Facilitate migrations to FOSS by government departments (Migrations can be application, desktop, back-end, enterprise systems)
Equity Performance Employment Equity: Actual Target • Race 62.83% - 60% • Gender 45.87% - 46% • Disability 1.34% - 1%
Key Human Capital Programs • Development of Core Technical Skills • Development: Leadership and Management Skills • Culture Improvement • Youth Internship Programme
Governance Structure • Audit and Risk Committee • Strong Internal Audit • Anti-Fraud hotline • All issues reported are investigated and appropriate action taken
Audit Report • Previous year • Unqualified • Emphasis of matter • Current year • Unqualified • No emphasis of matter
Audit Report (continued) • Items included in other matters: • Non-compliance with PFMA: • Contract Management System not in place • Approval to retain surpluses not requested from National Treasury • Non-compliance with SITA Act • Service Level Agreements not signed • Vacant prescribed Directors positions -- Managing Director and Legal Representative • Key Governance Responsibilities • Audit delays • Material audit adjustments to the annual financial statements (Projects) • Internal control weaknesses • Non-compliance with legislation • Information systems not supportive • Unresolved prior year audit findings • Various investigations as reported on in the audit report
Financial Performance • Revenue increased with 10% in line with the budget. Tariffs within the mainframe environment were lowered resulting in R225m less revenue than budgeted. • Suppliers were paid more promptly, but challenges were experienced in timeous debt collection. This impacted negatively on working capital and the organisation generated less cash from operations than budgeted. This impacted on our capital expenditure program. • Notwithstanding the above challenges and strategies put in place to address these problems, our solvency ration at the end of the year was 2.41:1 and our liquidity ratio was 1.98:1, leaving the company healthy and the financial structure sound.
Financial Performance, … • Highlights: • Revenue growth of 10% to R3,976 bn • Significant reduction in supplier payment periods • Solvency ratio 2.41:1 • Liquidity ratio 1.98:1 • Areas for improvement: • Debtor days: 65.87 days vs target of 65 days • Cash generated by operations: R87m vs budgeted R163m
Abridged Statement of Financial Performance for the year ended 31 March 2009
Abridged Statement of Financial Position as at 31 March 2009 Benchmark: Solvency ratio – 2:1, Liquidity ratio – 1.5:1
Abridged Cash Flow Statement for the year ended 31 March 2009
Revenue growth (continued) • Achieved budget revenue growth of 10% • Growth areas: • Labour ( 8%) • Network and internet (20%) • Software licenses and maintenance (27%) • Project revenue (159%) • Sundry (111%) • Reduction: • Computer equipment and maintenance (22%) • Mainframe income (10%)
Cost of sales (continued) • Increased from previous year: • Depreciation (66%) due to capital expenditure in previous and current year • Direct Labour (18%) due to higher demand • Service delivery overheads (48%) due to agency transactions and computer equipment and maintenance costs
Capital expenditure (continued) • Areas of spending on Capital Expenditure: • Buildings: R20m • Computer equipment: R110m • Office furniture: R33m • Intangible assets (software): R36m
Gross surplus (continued) • Reasons for decrease • Increase in agency transactions which translates into lower gross margin • Reduced tariffs in mainframe environment (R225m) to support lower expenditure for government
Operating expenses • Reasons for increase: • Operating leases (R13m) • Foreign exchange loss (R11m) • Impairment on trade receivables (R16m) • Audit fees (R4m)
Net surplus • Reasons for decrease • Lower gross surplus • Increase in Operating expenditure


![State Information Technology Agency Amendment Bill [B 24B -2002]](https://cdn5.slideserve.com/9676436/state-information-technology-agency-amendment-bill-b-24b-2002-dt.jpg)