Download
1 / 36
360 likes | 521 Views
Applications of the SEVIRI window channels in the infrared. jose.prieto@eumetsat.int. Lesson objectives. Learn which are the window channels in the infrared portion of SEVIRI Review the general characteristics of window channels

E N D
Applications of the SEVIRI window channels in the infrared jose.prieto@eumetsat.int
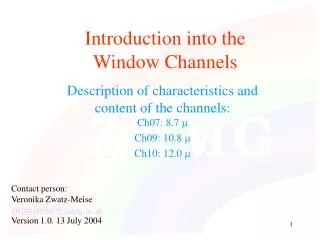
Lesson objectives • Learn which are the window channels in the infrared portion of SEVIRI • Review the general characteristics of window channels • Understand the behaviour of channels at 8.7, 10.8 and 12.0µm for different ground surfaces and cloud types • Practice and exercise on scene identification through window channel differences, like 10.8 – 12.0µm • Review the concept of semi-transparency • Becoming aware of applications to precipitation, sea surface temperature and ash monitoring
12 1 2 3 4 5 6 7 8 9 10 11
Window channels • Low absorption of radiation by water vapour • Sea Surface Temperature • Land is gray, not black (emissivity < 1) • Cloud Top Height • Cloud emissivity increasing with drop size (thin cloud) • Thin cloud looks warmer (semitransparency) than thick cloud • Skin (a few microns thick) is neither bulk nor air temperature • Land-sea contrast (especially summer and winter) • Poorer cloud texture than VIS • Higher cloud opacity than in visible channels
Channel 7 Channel 9 Channel10 Channels at 8.7, 10.8 and 12.0 µm
Surface properties Land emissivity grows from 11 to 12 µm, snow and water emissivity decreases
Compositing 8.7, 10.8 and 12.0 µm Dust composite Defined as a EUMETSAT standard for application in a wide range of regions - Ch 7 - Ch 9 -Ch 10 Regional and local enhancements
Channel comparison on water cloud 3 May 2005 09:00 Region of closed convective cells over the Atlantic, with probable local scale temperature inversions - Ch 7 - Ch 9 -Ch 10
212.7 Ice Cloud: Stronger signal in IR8.7 because of higher emissivity (or cumulus towers) 287.4 210.0 Cloud free ocean: Weaker signal in IR8.7 because of water vapour absorption 290.6 IR8.7 IR10.8
Differences for sand storms (Sahara) sand absorbs most at 10.8 µm BT ~ 300 K DBT ~ 4 K BT ~ 290 K DBT ~ 3 K BT ~ 280 K DBT ~ 3 K .. .... ...… . …. … … . .. …. .….… ….. .. . ………... Ch 7 9 10 . . . . . . . .. . . . CLEAR air << SAND storm >> ------ Desert surface ----- Brigthness (BT) and differential brightness temperatures (DBT) typical values for the three analysed channels
Differences for cloud Channel difference 8.7µm-12.0 µm is an ice-cloud index BT ~ 290 K DBT ~ 4 K BT ~ 230 K DBT ~ 1 K BT ~ 280 K DBT ~ 2 K O o o O o o o O X x xX x x x X Ch 7 9 10 liquid crystals CLOUD CLEAR air ------ Humid surface -----
The 7-9 difference 5 June 2003 12:00 Liquid cloud gulf of Sirte Ice cloud over Pyrenees Clear over grass Clear desert
Semi-transparency • E*Tc + (1-E)*Tg < BT WARM BIAS! • Thin cloud pixels provide two contributions: cloud and ground, with a bias towards the warm source. • The bias is weaker with increasing wavelength: flatter Planck response, lower sensitivity to temperature • The bias grows with cloud height (temperature contrast)
Assume same cloud emissivity in both channels: semitransparency effect E=0.3 E=0.6 E=0.8 E=1
Assume the same cloud emissivity in both channels: semitransparency effect The right hand side curving upwards in the constant-emissivity lines (in blue) is due to humidity absorption, stronger at 12.0µm The left hand side curving is due to cloud thinness: ground and cloud do not average temperatures linearly, but with a bias towards the ground temperature (warm end): the higher the difference Tground – Tcloud, the higher the bias In a typical scene, the cloud temperature is more constant than the fraction of cloud in the pixel (or its emissivity), therefore we observe the red lines (constant temperature) when looking at a group of pixels
Transparency: Mie and Planck The channel with the biggest Planck curvature (shorter wavelength) will show warmer signal for a mixture of cloud and ground. When taking channel differences, the emissivity in both channels will be typically different for the same cloud, even for thick cloud: Mie effect Ground E PLANCK MIE 12.0 1-E 8.7 Cloud Cloud Ground
Planck dependencies: wavelength and temperature 1% temperature change results in a S% increase in the energy count: S ~ 14400 / Wavelength (µm) / Temperature (K)) • S=14% at 3.9µm and scene temperature of 260 K • S ~ 4% for a warm scene at the split window • Radiation = Temperature raised to the S-th power: R ~ T ^ S • Inside a pixel, S determines the bias towards the warm part of the signal • Bigger bias for lower temperatures Fire onset is better detected than its progress. Cloud dissipation is better detected than cloud growth.
S (sensitivity) in channel 8.7µm and 305K is 5.3 Emissivity estimate: 1.0 -11.5/305 *S =0.8 for that desert.
The difference Ch7 - Ch9 • Water cloud ~ -3K • Ice cloud ~ 1K • Snow ~ -2K (water vapour) • Cloud boundaries < 6K, since they mix cloud and ground temperatures, in favour of the shorter wavelength
Ch 7 – Ch 10 Ch 10 Ch9 17-Feb-03 midday over desert • Several arcs indicate multilayered cloud • Pixels with a mixture of scenes show in the highest part of the arcs
MSG Channel HRV, 16:00 Semitransparent cloud shows higher difference (in ch7-ch9 or ch9-ch10) than opaque cloud (left hand side of graph) or ground (right hand side of graph)
MSG Channel 12, 4-July-200316:00 The difference Ch9 – Ch10 • Semitransparent cloud shows higher difference (ch9-ch10) than in (ch7-ch9) • Double arch: southern boundary is lower in height
MSG Natural RGB, 4-July-2003 10:00 UTC • 10.8µm is more absorbed and backscattered by sand than 12.0µm • For sand or ash, reversed arc for the semitransparent pixels
Negative ch9-ch10: • Thermal inversions in humid valleys • Dust cloud
Thick cloud Ch7-Ch9 Thin cloud (over sandy ground) very small ice particles very small droplets small ice particles small droplets big droplets big ice particles Ch9-Ch10 • Type of particles can be identified for thin cloud • Difficult discrimination for thick cloud
Cloud classification In the IR, the brightness temperature (BT) depends on: • 1. Absorption to scattering ratio (for thick cloud) The quotient between absorption and scattering efficiencies varies with wavelength and particle size/shape, and determines the cloud emissivity • 2. Wavelength (for thin or broken cloud): Thin cloud favours the BT at the shorter wavelength for emissivities far from unity. • 3. Humidity (for low cloud): Channel at 10.8µm is favoured under humid conditions. Absorption by humidity reduces the 8.7µm signal most. • 4. Ground emissivity (for clear skies or thin cloud): The emissivity grows for most kind of soils from 11 to 12µm, but decreases for water and snow covered surfaces.
From particle size to emissivity 1) Calculate the size parameter X=2πre/λ 2) Use the imaginary refractive index n’ (and the real part n) to get the Efficiencies: (X, n’, n) [Mie functions] (Eabs /Escat) ~ cloud emissivity Example: 3µm ice crystals At 10.8µm, CE=.995 At 12.0µm, CE=.991 [BT10.8 – BT12.0] ~ 0.3 K Hardly detectable by SEVIRI emissivity Log(Eabs/Escat)
10.8 µm, winter day ? C. Sea A. Ice cloud B. Thin cloud
Applications of the split window • Sea surface temperature • Cloud top temperature • Low level humidity • Aerosol (saharan air layer, SAL) • Semitransparent cloud • Precipitation estimates (MPE) • Clear-sky radiances for NWP
Precipitation estimation 24 July 2005 14:00 Multisensor Precipitation Estimate: IR calibrated with SSM/I
Precipitation estimation 18 May 2001 14:00 • Adequate to estimate convective precipitation in tropical regions • Underperformance for high latitudes
SST Eddies in the South Atlantic MSG-1, 3 May 2004, 14:00 UTC RGB Composite 02,09,10 OSI SAF 12-hourly SST Product Changes of up to 10K in SST in 100 km
Ocean eddies off Cape Fria (Namibia-Angola) Meteosat-8 25-5-06 07:45 Best contrast in the early morning The Sun activates the heat exchange and diffuses the contrast
Aerosol, ash, fumes • Negative channel difference 10.8 µm - 12.0 µm identifies sand grains and volcanic ash • Volcanic gases show in the window channels, due to line absorption: Channels 7.3µm and 8.7µm respond to SO2. Negative channel difference (8.7 µm - 12.0 µm) identifies burnt sulphur compounds. • Note: possible confusion of SO2 with desert surfaces or dust cloud • Over clear desert, the strong difference Ch7-Ch9 gets blurred by dust (scattering more on 10.8 µm)
Conclusions • Channels at 8.7µm, 10.8µm and 12.0µm provide information on cloud phase and height, even allow inferences on particle size for thin cloud • Those channels provide information on ground characteristics, in particular for discrimination of humid and arid areas • A novel application is the monitoring of sand and smoke clouds, as a major risk for air navigation and ground pollution