Download
1 / 18
180 likes | 352 Views
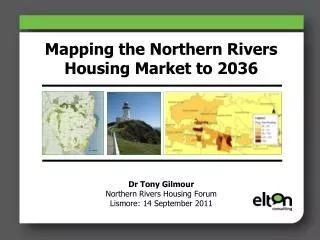
Mapping the Northern Rivers Housing Market to 2036 Dr Tony Gilmour Northern Rivers Housing Forum Lismore: 14 September 2011. Presentation Overview. Demographic changes Regional housing supply/demand and affordability issues Social impacts of housing market challenges.

E N D
Mapping the Northern Rivers Housing Market to 2036Dr Tony GilmourNorthern Rivers Housing ForumLismore: 14 September 2011
Presentation Overview • Demographic changes • Regional housing supply/demand and affordability issues • Social impacts of housing market challenges
Northern Rivers Housing Market • Study area • Focus on 7 council areas of the Northern Rivers Housing Forum • 6 in ‘Far North Coast’ NSW Planning region • No NSW regional planning authority • Housing market characteristics: • Series of distinct housing sub-markets • Dispersed population, mainly living in villages and smaller towns • Greatest growth in coastal areas
1 Demographic Changes
Demographic Trends • Population drivers: • Impact from rapid growth of South East Queensland • Pacific Coast Highway Upgrade • Sea- and tree- change migration • By 2036 population +39% (Sydney 40%, Brisbane +64%) • Trends: • Ageing population - over 65s will double by 2026 to 32% • Fewer young people 2001-2005
2 Housing Supply, Demand and Affordability
2036. Table 6: Housing demand to 2036 Source: NSW Government (2006, 2009b) for first five rows Housing Demand and Supply • Housing demand forecast based on growing population and reducing occupancy. NSW Government estimate need 70,000 dwellings by 2036 • Housing supply hard to estimate. NSW Government consider 51,000 possible, though UDIA and MacroPlan challenge these numbers, especially in Tweed and Byron ‘hot spots’ • Nationwide, supply not keeping pace with demand. Estimated 90,000 dwellings pa shortfall. This is the main driver of affordability problems
Housing Affordability • Relative lack of some higher income jobs • Far lower median incomes than Sydney or NSW, esp. Kyogle and Clarence Valley • Rents lower than Sydney and NSW, though less gap in sales prices • High levels of households in rental stress. Byron, Tweed and Balina higher than Sydney • Richmond and Kyogle are relatively affordable for renters and purchasers • Moderate income households (80-120% levels) also in housing stress - in Byron Shire 49% renters; 37% purchasers
Rental prices Weekly rents in $
Affordability and Housing Stock • Built form dominated by detached houses • Higher owner occupation than in Sydney or across NSW • Social housing rental low, especially in certain council areas • Strong presence of community housing - mainly North Coast Community Housing (835 units). Housing NSW down to 2,470 units after estate stock transfer in Byron of over 200 units • Low impact from National Rental Affordability Scheme (NRAS)
Alternative Dwellings • Caravan parks and holiday villages a traditional source of affordable housing, especially in coastal areas • Competition for land driven by sea change migration and tourism • Loss of alternative dwellings a major issue (420 sites lost 2001-2004 in region: research by Caroline Squires)
3 Social Impacts
Homelessness • Chart shows ‘primary’ homeless - typically rough sleepers and those in improvised dwellings • Highest concentrations of homeless population are in areas in the region with greatest housing stress • 51% of the regions entire homeless population are in Tweed Heads • In 2006 region had 3% of NSW population by 6% of homeless
Social Needs • SEIFA measure of social disadvantage used by ABS (income, education, housing, unemployment) • Several areas in region in top 40% of NSW disadvantage - especially in Lismore and Ballina council areas • Challenges for human service provision across the region • Isolated areas of disadvantage away from jobs and transport • Rural isolation, especially in areas of declining population
Mapping the Northern Rivers Housing Market to 2036Dr Tony Gilmourtony@elton.com.auwww.tonygilmour.com