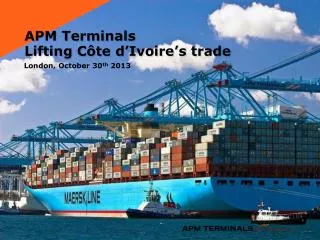
APM Terminals
APM Terminals. Company presentation . August 2009. Agenda. A.P. Moller- Maersk Group Heritage APM Terminals Today A Look at the Industry and Market. APM Terminals: Part of the A.P. Moller–Maersk Group . A.P. Moller-Maersk Group HQ: Copenhagen, Denmark 2008 Revenue: $61.2 b

APM Terminals
E N D
Presentation Transcript
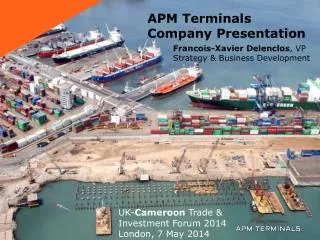
APM Terminals Company presentation August 2009
Agenda • A.P. Moller- Maersk Group Heritage • APM Terminals Today • A Look at the Industry and Market
APM Terminals: Part of the A.P. Moller–Maersk Group • A.P. Moller-Maersk Group • HQ: Copenhagen, Denmark • 2008 Revenue: $61.2 b • in Shipping, Container Business, Energy, Retail and Banking. • 120,000 employees, 130 countries. • APM Terminals • HQ: The Hague, Netherlands • 2008 Revenue: $3.1 b • +24% over 2007. • Container volume: 34 million TEUs (weighted by terminal equity share), +8% • 20,000 employees, 34 countries.
Our position within the Group Nils S. Andersen* CEO CFO Group Human Resources Bill Allen Group Legal Christian Kledal Group Accounting Per Møller Group Relations Steen Reeslev Group Finance & Risk Management Jan Kjærvik Group IT Flemming Steen Group Strategy Martin Thaysen Investor Relations Anders M. Christensen Special Projects Flemming Ipsen Maersk Oil Thomas Thune Andersen* Odense Steel Shipyard Finn Buus Nielsen Maersk Drilling Claus V. Hemmingsen* Maersk Line Eivind Kolding* APM Terminals Kim Fejfer Maersk Tankers Søren Skou* Dansk Supermarked Erling Jensen Maersk FPSOs Paul C. Pedersen Safmarine Ivan Heesom-Green Maersk Logistics / Damco Rolf Habben-Jansen Container Inland Services Nigel Simon Pusey Norfolkline Thomas Woldbye Maersk Supply Service Carsten P. Andersen Oil Trading Niels Henrik Lindegaard Svitzer Jesper Teddy Lok Procurement Steen S. Karstensen Technical Organisation Leif Nielsen Corporate Centre * Partner and member of the Executive Board Service Function
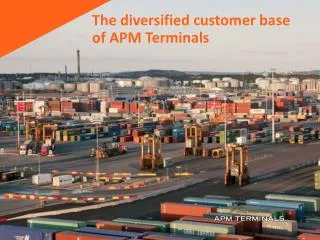
Core Business • The design, development, implementation, operation and management of the world’s only true geographically balanced Global Container Terminal Network. • Our portfolio includes 50+ terminals and offices in 34 countries, on five continents. • APM Terminals has an annual throughput of 34 million TEUs and global market share of 6.6%
Half a Century of innovation, growth and progress at the forefront of a world-changing industry. 1958 First dedicated A.P. Moller terminal facility opens, at the Port of New York 1970s Containerization begins to change patterns of global trade and growth 1980s Ongoing evolution of containerization and economic efficiencies of international trading patterns lead to the rapid establishment of global port load centers and transhipment networks, requiring highly coordinated and specialized container terminal operations and equipment to accommodate ever larger vessels and container flows 1999 Maersk Line acquisition of Sea-Land enlarges scope of terminal operations globally 2001 Established as independent container terminal operating company within Maersk Line 2004 Spun off as independent corporate entity, headquarters in The Hague, Netherlands 2007 Revenue of $2.5 billion, $111 million in profit; APMT reports earnings separately 2008 Only true Global Terminal Network in port industry; throughput 34 million TEUs
Agenda • A.P. Moller-Maersk Group Heritage • APM Terminals Today • A Look at the Industry and Market
Since establishment as a separate and independent business unit in 2004, APM Terminals has thrived Revenue APM Terminals Financial results 2004-2008 (USD million) Operating Cash Flow Net Result 3,126 2,520 2,068 1,504 1,313 502 259 160 223 226 125 106 98 48 75
APM Terminals’ Volume Growth APM Terminals 2008 Throughput: 34 million TEUs* *Weighted by terminal equity share
A strong performance in 2008 despite the global economic downturn; outperforming the market 1st Quarter 2009 • In face of severe industry downturn and global economic recession, priority of cost reductions and operational improvements at existing terminals • Investment focus on existing terminals and projects including Luanda (Angola), Apapa (Nigeria) and Cai Mep (Vietnam) • 1st Q 2009 Revenue: USD 675 million • 1st Q 2009 EBITDA: USD 131 million • 1st Q 2009 overall global container volume decline of 16% • 1st Q 2009 APM Terminals adjusted volume decline of 8%
Business Divisions are divided into Existing Terminals and New Terminals to optimize focus and performance. CEO Kim Fejfer Strategy Francois-Xavier Delenclos Finance, Legal, Tax & IT Christian Laursen HR Tiemen Meester Commercial Dick Mitchell Communications Pieter Schaffels EXISTING TERMINALS: Africa, Mideast and India Charles Menkhorst EXISTING TERMINALS: Europe Martin Poulsen EXISTING TERMINALS: Asia Pacific Martin Christiansen EXISTING TERMINALS: Americas Eric Sisco NEW TERMINALS Peder Sondergaard Klaus Sejling
Asia Shanghai, China Europe Rotterdam, Netherlands Africa, Middle East and India Dubai, United Arab Emirates Regional structure Corporate Head office The Hague, Netherlands Americas Portsmouth, Virginia USA • Better access to customers and markets. • Accelerated decision-making and execution.
An example of putting our ambition into practice - In Apapa, Nigeria we significantly improved service & safety levels Takeover • What did we do? • Reduced vessel waiting time • Improved Safety and Security • Increased capacity and throughput • Total CAPEX ~200m USD Before takeover After takeover
Another example: Aqaba Container Terminal - a successful privatization • What did we do? • Investment in Cranes (Phase 1) • Yard Procedures and IT Systems • Improved Productivity • Signed Management Agreement (2004) • Joint Development Agreement - 25 Years (2006) • ACT Before APM Terminals • Terminal Congestion • Extreme delay of Vessel & Container Delivery • No Safety & No IT system • ACT Present • 42.7% Volume Growth in 2008 • Gateway to Iraq and Levant • Sustained Profitability & competitiveness • Putting local staff in senior positions • ACT Future • 750.000 TEU Capacity • Investment in Cranes and Extension of the wharf • The preferred Port in the Red Sea. • 2.4 m TEU Capacity in 2020
Agenda • A.P. Moller-Maersk Group Heritage • APM Terminals Today • A Look at the Industry and Market
Container Terminals Serve the World’s Containerized Trade • Today, 6,050 vessels serve liner trade routes, representing an aggregate container capacity of 13.2 million TEUs. • Of these, 4,684 are pure containerships, representing approximately 12.5 million TEUs of capacity. • There are an additional 748 container vessels on order, representing an additional 4.7 million TEUs of capacity, or 37% of the existing fleet capacity. • The three largest containership operators account for more than one third (34.2%) of the world’s total containership capacity. • The top seven shipping companies represent half (50%)of the total global fleet’s current containership capacity.
The Global Container Terminal Industry has enjoyed consistent growth World container port throughput • 10% CAGR from 1990 - 2007 • 0% for 2009 / 2010 ? • 6 - 8% CAGR next 5 years?
World’s Largest Containerports: 2008 APM Terminals Global Terminal Network locations in Bold Italic (Source: Containerisation International)
Top 20 Containership Lines (Fleet Capacity) (Source: AXS-Alphaliner, March 2008)
APM Terminals: redefining the industry it helped to create. • Most geographically balanced portfolio of any operator. • Strong financial backing of A.P. Moller-Maersk Group. • Industry-leading, customer-driven efficiency and innovation. • As an independent operator can serve multiple customers. • Comprehensive new terminal development and existing facility expansion. • Equipped to serve larger vessels entering the global fleet. • Corporate commitment to improvement in: • Health and Safety • Security • Environment • Society