Download

1 / 44
440 likes | 583 Views
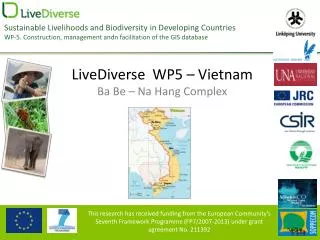
LiveDiverse Biophysical Vulnerability. Ba Be Case Study. Do Minh Phuong National Institute of Agricultural Planning and Projection, Vietnam LiveDiverse South Africa meeting 13 - 23 March 2010. Case Study. Ba Be National Park ( 22°21' – 22°29'N, 105°34' – 105°42'E ). Vulnerability.

E N D
LiveDiverseBiophysical Vulnerability Ba Be Case Study Do Minh Phuong National Institute of Agricultural Planning and Projection, Vietnam LiveDiverse South Africa meeting 13- 23 March 2010
Case Study • Ba Be National Park (22°21' – 22°29'N, 105°34' – 105°42'E)
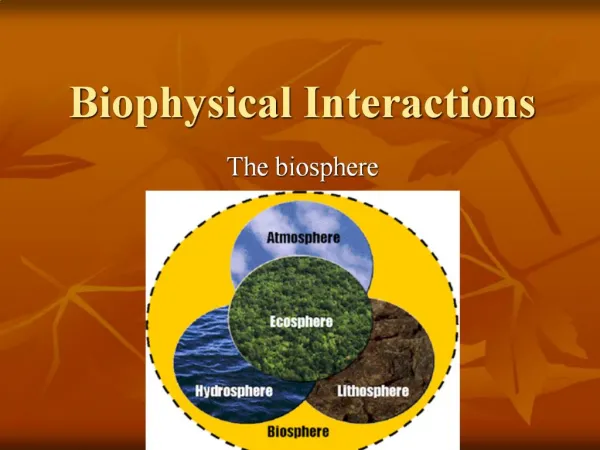
Vulnerability Characteristics of a country Climate change Forces of Nature Human use
Vulnerability Mapping The EVI scale is a relative scale of vulnerability ranging from 1 – least vulnerable (most resilient) to 7 – most vulnerable (least resilient).
Data requirement • The EVI by its very essence attempts to summarise a wide variety of environmental vulnerability data for a country. The data needed encompasses a range of environmental factors from: • meteorological data, • sea surface temperature, • geological and geographical information, • biological species and habitat data, • reserves, • human activities such as fishing, mining, pollution, population, legislation etc. • The diverse and wide-ranging nature of these data means that sources are widely dispersed and often require some effort to identify, collect and compile information.
Calculation Method Manual on How to use the Environmental Vulnerability Index (EVI)
Biophysical Vulnerability Biophysical Vulnerability Physical indices Biological indices
Physical indices • Highwinds • Dried periods • Wet periods • Hot periods • Cold periods • Sea surface temperature • Vocalnoes • Earthquakes • Tsunami • Slides • Land area • Country dispersion • Isolation • Vertical relief • Lowland • Shared border • Vegetation cover • Loss of cover • Fragmentation of land • Degradation • Terrestrial reserves • Marine reserves
Biological indices Ecological imbalance Migratory species Endemic species Number of introduced species Endangered species Extinctions SO2 emission
EVI Calculation Babe Case
High winds Average annual excess wind over the last five years (summing speeds on days during which the maximum recorded wind speed is greater than 20% higher than the 30 year average maximum wind speed for that month) averaged over all reference climate stations. EVIhighwinds = 1
Dried Periods Average annual rainfall deficit (mm) over the past 5 years for all months with >20% lower rainfall than the 30 year monthly average, averaged over all reference climate stations. EVIDried Periods = 4
Wet Periods Average annual excess rainfall (mm) over the past 5 years for all months with >20% higher rainfall than the 30 year monthly average, averaged over all reference climate stations. EVIWet Periods = 4
Hot Periods Average annual excess heat (degrees Farenheit) over the past 5 years for all days more than 9F (5°C) hotter than the 30 year mean monthly maximum, averaged over all reference climate stations. EVIHot Periods = 3
Cold Periods Average annual heat deficit (degrees) over the past 5 years for all days more than 5°C cooler than the 30 year mean monthly minimum, averaged over all reference climate stations. EVICold Periods = 1
Sea Surface Temperature Average annual deviation in Sea Surface Temperatures (SST) in the last 5 years in relation to the 30 year monthly means (1961-1990) EVISST = N/A
Vocalnoes Cumulative volcano risk as the weighted number of volcanoes with the potential for eruption greater than or equal to a Volcanic Explosively Index of 2 (VEI 2) within 100km of the country land boundary (divided by the area of land). GIS EVIVocalnoes = N/A
Earthquakes Cumulative earthquake energy within 100km of country land boundaries measured as Local Magnitude (ML) ≥ 6.0 and occurring at a depth of less than or equal to fifteen kilometres (≤15km depth) over 5 years (divided by land area) GIS EVIEarthquakes = N/A
Tsunami Number of tsunamis or storms surges with run-up greater than 2 metres above Mean High Water Spring tide (MHWS) per 1000km coastline since 1900 GIS EVITsunami = N/A
Slides Number of slides recorded in the last 5 years (EMDAT definitions), divided by land area GIS EVISlides = No data
Land Area Total land areas (sq km) GIS
Country Dispersion Ratio of length of borders (land and maritime) to total land area GIS EVILand Area = 1
Isolation Distance to nearest continent (km) GIS EVIIsolation = N/A
Vertical Relief Altitude range (highest point subtracted from the lowest point in country) GIS EVIVertical Relief = 1
Lowlands Percentage of land area less than or equal to 50m above sea level GIS EVILowlands = N/A
Shared Borders Number of land and sea borders shared with other countries GIS EVIShared Borders = N/A
Vegetation Cover Percentage of natural and regrowth vegetation cover remaining (include forests, wetlands, prairies, tundra, desert and alpine associations). GIS EVIVegetation Cover = Undone
Loss of Cover Net percentage change in natural vegetation cover over the last five years GIS EVILoss of Cover = Undone
Fragmentation Total length of all roads in a country divided by land area GIS EVIFragmentation = 3
Degradation Percent of land area that is either severely or very severely degraded (FAO/AGL Terrastat definitions) GIS EVIDegradation = Undone
Terrestrial Reserves Percent of terrestrial land area legally set aside as no take reserves GIS EVITerrestrial Reserves = Undone
Marine Reserves Percentage of continental shelf legally designated as marine protected areas (MPAs) GIS EVIMarine Reserves = N/A
Ecological Imbalance Ecological Imbalance as weighted average change in trophic level since fisheries began (for trophic level slice ≤3.35) EVIEcological Imbalance = Undone
Migratory Species Number of known species that migrate outside the territorial area at any time during their life spans (including land and all aquatic species) / area of land EVIMigratory Species = 6
Endemic Species Number of known endemic species per million square kilometre land area EVIEndemic Species = 7
Introduced Species Number of introduced species per 1000 square kilometre of land area EVIIntroduced Species = 7
Endangered Species Number of endangered and vulnerable species per 1000 sq km land area (IUCN definitions) EVIEndangered Species = 7
Extinctions Number of species known to have become extinct since 1900 per 1000 sq km land area (IUCN definitions). EVIExtinctions = 7
SO2 Emissions Average annual SO2 emissions over the last 5 years GIS EVISO2 Emissions = No data
Other EVIS (31)* Fertilisers = 3 (32) Pesticides = 5 (43) Sanitation = 6 (44) Vehicles = 5 (45) Population = 4 (46) Population Growth = 5 (37) Tourists = 1 * (31), (32)… are EVI number
Discussions Data collection issues Obsevation method (highwinds). Missing data (no data). Data availability (less than requirement) GIS data (georeferencing).
Thank you very much for your attentions! Click here for the last word
Any comments? www.livediverse.eu