Download
1 / 32
320 likes | 435 Views
Biology 423 Research Paper: Genetics behind cloning of a human gene:. Outlines due today. Mapping genes by recombination frequency. Test cross to monitor recombination between different genes Frequency of recombination is directly related to distance between genes (loci) on chromosome

E N D
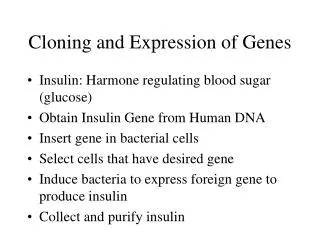
Biology 423 Research Paper: Genetics behind cloning of a human gene: Outlines due today
Mapping genes by recombination frequency Test cross to monitor recombination between different genes Frequency of recombination is directly related to distance between genes (loci) on chromosome Three point cross
Traits for our three point cross Body color; yellow vs wild type Bristles: forked vs straight (wild type) Crossveins: crossveinless vs wild type
Test cross vg b pr / vg+ b+ r+X vg b pr / vg b pr Punnet square: Male Female vg+b+pr+vg b+pr+ vg+b pr+ vg b pr+ vg+b+ pr vg b+pr vg+b pr vg b pr Vg b pr vg+b+pr+vg b+pr+ vg+b pr+ vg b pr+ vg+b+ pr vg b+pr vg+b pr vg b pr 1:1:1:1:1:1:1:1 ratio of phenotypes if genes are not linked If genes are linked, parental combinations of alleles are overrepresented in progeny
Calculate distance between pairs: vg to pr: add up all classes with a recombination event between vg+ and pr or vg and pr+ 252 + 241 + 13 + 9 = 525 Divide by total number of chromosomes scored: 525/4197 X 100 cM = 12.5
Calculate distance between pairs: pr to b: add up all classes with a recombination event between pr+ and b or pr and b+ 131 + 118 + 13 + 9 = 271 Divide by total number of chromosomes scored: 271/4197 X 100 cM = 6.4 The distance between vg and b is the sum of the distance between vg-pr and pr-b 12.3 + 6.4 = 17.7
How do we map genes in humans? Relative association of markers: Allelic variants will co-segregate if the genes are closely linked on a chromosome. Map distances depend on frequency of recombination
To map a human genetic trait: Look for association between mapped markers and a trait of interest Markers can be traits, proteins or DNA sequences Anything that is polymorphic can be mapped We can translate map position into DNA sequence by determining the linkage between DNA-based markers and traits.
Screen family members for RFLP markers linked to trait
RFLP polymorphisms reveal genetic differences 2. Separate DNA fragments by size on an agarose gel 3. Hybridize to single copy radioactive probe- Southern Blot 1. Cut genomic DNA with Restriction enzymes
Test degree of linkage: odds of linkage Data looks like M1 is linked to SF. Mother has two M1 alleles. Her chromosome is uninformative, like a test-cross. Father has two different M alleles. Recombination of his alleles can be seen in this pedigree. In this family, there are 8 informative chromosomes. 1 has a recombination event. Therefore, we estimate map distance as 1/8X 100 cM. 12.5%
Odds of Linkage is (Probability gene and marker are linked at a certain map distance) divided by (Probability they are unlinked). In our case: L = 6.1 Log of L or LOD = 0.8 Maximum likelihood odds of linkage; Change estimated linkage Distance p(.1) to get the best LOD score for the data.
Calculate Lod score Odds of linkage Probability gene and marker are linked at a certain map distance / Probability they are unlinked. Calculate maximum odds for data. Predicted linkage distance gives best odds Add up log of odds for many families to get more data
To achieve significant LOD score: Combine odds of linkage for many families: p1(L)/p1(NL) x p2(L)/p2(NL) xp3(L)/p3(NL) In practice we combine the log of odds: LOD1 + LOD2 + LOD3. Continue until LOD > 3.0 before linkage is accepted Linkage distance is based on the linkage distance that gives the maximum value for the data.
If genes and markers are unlinked the p(L)/p(NL) will be <1.0 in some families and the LOD will be Negative. Therefore, as you add more families the LOD will only increase if the data of the majority of families supports linkage.
How to calculate LOD score for the example used in lecture 1. Probability SF and M loci are unlinked: Father is SF/sf and M1/M2. Mother is sf/sf and M1/M1. Her gametes are all the same. Her alleles can be ignored here. Chance of each allele combination in children if SF and M are unlinked is: 1SFM1;1SFM2;1sfM1;1sfM2 Probability of any genotype is .25
With 8 children of genotypes: sfM2;SFM1;sfM2;SFM1; sfM2;SFM1;sfM2;SFM2 P(SF and M unlinked) = .25 x .25 x .25 x .25 x .25 x .25 x .25 x .25 = .0000153
Probability SF and M1 are linked at 10 map units: (10 is chosen arbitrarily to start. Other map distances will also be tested). Chance of each allele combination in children is .45 SFM1; .05 SFM2; .05 sfM1; .45 sfM2 With 8 children of genotypes: sfM2;SFM1;sfM2;SFM1;sfM2;SFM1;sfM2;SFM2 p(SF and M1 are linked at 10 cM) = .45 x .45 x .45 x .45 x .45 x .45 x .45 x .05 = .003736
BUT - formally you don’t know the phase of the two alleles of SF and M: If the genes were linked so that SF and M2 were on the same chromosome: Chance of each allele combination in children is .05 SFM1; .45 SFM2; .45 sfM1; .05 sfM2 With 8 children of genotypes: sfM2;SFM1;sfM2;SFM1; sfM2;SFM1;sfM2;SFM2 p(SF and M2 are linked at 10 cM) = .05 x .05 x .05 x .05 x .05 x .05 x .05 x .45 = .000023
Odds of Linkage is L = {½ p(SF and M1 are linked at 10 cM) + ½ p(SF and M2 are linked at 10 cM)} Divided by p(SF and M are unlinked) In our case: L = [½(.003736) + ½(.000023)]/.0000153 L = 6.1 Log of L or LOD = 0.8 Maximum likelihood odds of linkage; Change estimated linkage Distance p(.1) to get the best LOD score for the data.
To achieve significant LOD score: Combine odds of linkage for many families: p1(L)/p1(NL) x p2(L)/p2(NL) xp3(L)/p3(NL) In practice we combine the log of odds: LOD1 + LOD2 + LOD3. Continue until LOD > 3.0 before linkage is accepted Linkage distance is based on the linkage distance that gives the maximum value for the data.
If genes and markers are unlinked the p(L)/p(NL) will be <1.0 in some families and the LOD will be Negative. Therefore, as you add more families the LOD will only increase if the data of the majority of families supports linkage.
Summary • 100’s of DNA markers mapped onto each chromosome – • high density linkage map. • the relative location of 100s of polymorphic DNA markers • on chromosomes can be mapped using mapping panels. • 2. identify markers linked to trait of interest by recombination analysis. • Use LOD score to determine if markers are linked to gene in • human families. The LOD score allows you to compare families • in which marker and gene are either in repulsion or in coupling.