Download
1 / 16
180 likes | 322 Views
Learn about adherence to National Physical Activity Guidelines, assess participation trends, and analyze sedentary behavior data in Australia. Discover insights on adult sedentary behavior, child and adolescent activity patterns, and more.

E N D
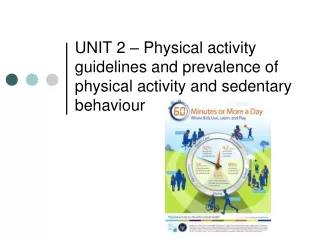
UNIT 2 – Physical activity guidelines and prevalence of physical activity and sedentary behaviour
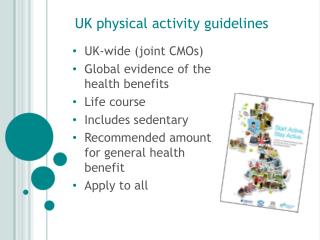
Key knowledge • The dimensions of the Australian National Physical Activity Guidelines for all stages of the lifespan • Current levels of physical activity and sedentary behaviour in Australia
Key skills • Describe the National Physical Activity Guidelines across the lifespan and assess the adherence to these guidelines • Collect, analyse and interpret data relating to the current levels of physical activity and sedentary behaviour in Australia
Participation in physical activity • The Multi Purpose Household survey found that 66 per cent of Australians (15+ years) participated in physical activity at least once for recreation, exercise or sport during the week • While that sounds like a lot only 29 per cent participate more than twice per week
Participation rates • What do you think is responsible for the decline in participation rates in sports and physical exercise as people age? • What is the noticeable difference between 35 and 64?
Participation rates questions • What were the most common physical activities in which men participated? • What were the most common physical activities in which women participated? • Identify three activities that displayed a high participation rate among males and females • Record the participation rate for three of your favourite activities among both males and females based on the top 10 list • Explain the key differences in participation rates between sexes for several major team sports
Adult sedentary behaviour • Our lifestyles require us to do a lot of sitting – this is why it is important for school students to do compulsory physical activity each day • A typical day for a a person involved in business can take them from their bed to a chair, to another chair, to the car, back to a chair and then back to bed
Adult sedentary behaviour • Research has shown that adults spend the following amount of time engaged in sedentary behaviour such as: • Watching television (men 12, women 10 hours/week) • Sitting socialising (men 6.8, women 7hours/week) • Reading (men 5, women 4.7 hours/week) • Relaxing/resting (men 3.7, women 3hours/week) • Listening to music (men 2.9, women 2.6 hours/week) • Talking on the phone (men 1.4, women 2.3 hours/week) • Using a computer (men 2.2, women 1.3 hours/week) • Construct a graph that includes this information and construct a list of how many times you would participate in the following activities in a week
Child and adolescent physical activity patterns • The ABS collected data about children’s participation in organised sporting activity and there was an increase by 3 per cent from 2000-2006 • 69 per cent of 9-16 year olds managed at least 60 mins of moderate to vigorous physical activity • Only 33 per cent met the recommended 2 hour maximum screen time – leaving 67 per cent watching more than 2 hours of screen time per day • How much screen time do you participate in during the day and on average for a week?
Step challenge • Below is the average amount of steps taken per day for different age groups • How do you stack up against these figures and are you prepared to take the 24 hour challenge?
Analysing data • What can you notice about the information supplied in the below data?
Analysing data • What can you notice about the information supplied in the below data?
Review questions • Go to the blog and complete the attached review questions for chapter 13 or work off page 283 in the Nelson text book • Review the chapter summary notes and include any information that is missing from your notes • Use your notes and Nelson text to assist you with the answers • www.winningwithwalshy.wordpress.com