Download
1 / 37
370 likes | 386 Views
Supply. Chapter 5. Chapter Essential Questions. 5-1 EQ: What does supply and demand have in common? How are they different? 5-2 EQ: What is the theory of production? Explain. 5-3 EQ: What is the difference between a fixed cost and a variable cost?. 5-1 What is Supply?.

E N D
Supply Chapter 5
Chapter Essential Questions 5-1 EQ: What does supply and demand have in common? How are they different? 5-2 EQ: What is the theory of production? Explain. 5-3 EQ: What is the difference between a fixed cost and a variable cost?
I. An Introduction to Supply A.Supply: the amount of a product that would be offered for sale at all possible prices that could prevail in the market.
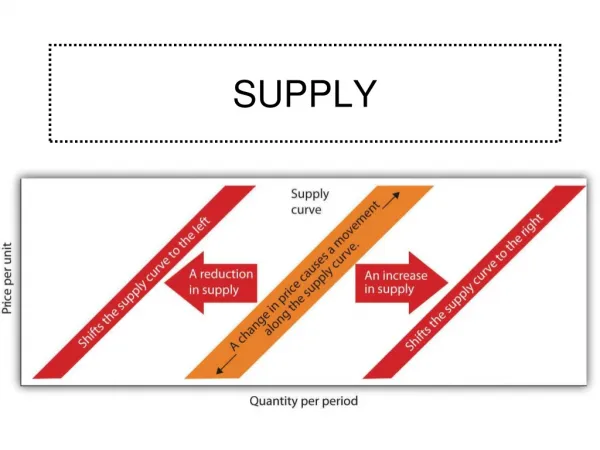
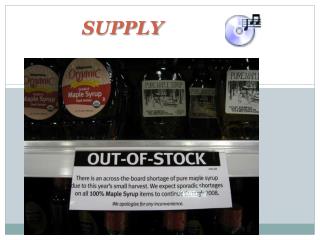
B. The Law of Supply: The principle that suppliers will normally offer more for sale at high prices and less at lower prices.
C. Supply Schedule • A listing of the various quantities of a particular product supplied at all possible prices.
D. Individual Supply Curve • A graph showing the various quantities supplied at each and every price that might prevail in the market. The more consumers are willing to pay, the more the supplier will provide.
Individual Question • What is the difference between a supply schedule and a supply curve? • Schedule=Chart • Curve=Graph
E. Market Supply Curve • Supply curve that shows the quantities offered at various prices by all firms that offer the product for sale in a given market. • Turn to Page 115. • Added both businesses on the schedule and then graphed it.
II. Change in Supply A. Situation where suppliers offer different amounts of products for sale at all possible prices in the market. To the right=Increase To the left=decrease
B. What Causes the Shift? 1. Cost of Inputs • Supply might increase because of a decrease in cost of inputs, such as labor or packaging. 2. Productivity • Workers are motivated and more efficient. Make more products in less time. Mo products = Mo Money!! 3. Technology • Introduction of new machines or techniques produces more products at faster rate.
…Continued 4. Taxes and Subsidies • Outside costs such as taxes or subsidies (government payment) encourage supply. Less outside costs=more money into products. 5. Expectations • If prices are expected to rise they may drawback and wait for prices to lower. Causing shift to the LEFT. 6. Government Regulation • New laws such as auto safety airbags makes it cost more to produce. Making supply curve go to LEFT. 7. Number of Sellers • The larger the number of sellers the greater the market supply. Shifts to the RIGHT.
III. Elasticity of Supply Turn to Page 119 A. Elastic Supply = Change of price causes large change in quantity. B. Inelastic Supply = Change of price causes small change in quantity. D. Supply Elasticity: Measure of the way in which quantity supplied responds to a change in price. C. Unit Elastic Supply = Change in price causes proportional change in quantity supplied.
A. Determinants of Supply Elasticity • Depends on the nature of its production. • Ex: Kites and Candy are elastic because it can be made quickly without huge amounts of labor or capital (machinery, etc). • Ex: Oil companies are inelastic because of how much labor and capital go into the production of oil.
5-1 EQ What does supply and demand have in common? - They both represent values through either a schedule or a curve. - They both represent different quantities of a product at various prices. How are they different? - Demand: represents consumers -Supply: represents producers -Demand: downward slope - Supply: Upward slope
I. The Theory of Production • Deals with the relationship between the factors of production and the output of goods and services • Theory based on: • Short run • Period of production that allows producers to change only the amount of variable input called labor. • Long Run • Period of production long enough for producers to adjust the quantities of all their resources including capital. • Example: • Short Run: Ford hires 300 new workers for one of its plants. • Long Run: Ford builds a new factory.
II. Law of Variable Proportions A. States that in the short run, output will change as one input is varied while others are held constant. • Example: You a preparing a meal. A dash of salt will do the trick. A bit more also might, but too much will ruin the meal. • A farmer has the land, machines, workers, and other items needed to produce crop. However, how much fertilizer should farmer use? What amount will be most successful and efficient. • Fertilizer is the variable input.
III. The Product Function A. A concept that describes the relationship between changes in output to different amounts of a single input while other inputs are held constant. • Ex: No workers = no output. • One worker = 7 units • Two workers = 20 units.
Production Function B. Total Product = total output produced by firm. i. Total Product rises when more workers operate machinery, other workers specialize on certain tasks. ii. Total Product slows when workers get in the way of each other. It gets too crowded. • Must factor in before hiring.
C. Marginal Product A. Marginal Product is known as the extra output or change in total product caused by addition of one or more unit of variable input. i. Change in total product from previous step.
Discussion Question From your experience in working in groups for a class assignment, how many students make up a productive team? When is adding more group members likely to cause a “decline in total product”?
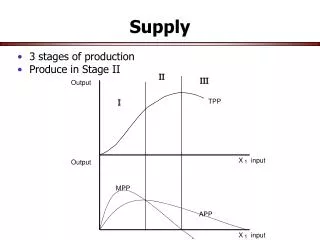
IV. 3 Stages of Production • Stages of Production • Increasing returns, diminishing returns, and negative returns based on marginal product changes as the variable input of labor is changed.
A. Stage 1 1. Stage of Increasing returns. i. Marginal output increases by large amount. ii. Many businesses do not stay at stage one because it is tempted to hire more workers for more output.
B. Stage 2 1. Total production keeps growing, but by smaller and smaller amounts. • More workers may stock shelves, package, or clean, while make workers producing on machines. • Each additional worker is making a diminishing contribution, but still positive output. This is know as diminishing returns.
C. Stage 3 1. The firm has hired too many workers. i. Starting to get in each other’s way. Marginal product becomes negative.
5-2 EQ What is the theory of production? Explain.
I. Measures of Cost A. Businesses must analyze costs before making its decisions. B. Costs are divided into several categories: i. Fixed costs: costs businesses incur even when plant is idle. • Total fixed costs = overhead. • Ex: salary, rent, taxes. ii. Variable Costs: cost that changes when the business rate of output changes. • Ex: Electric power, overtime, bonuses.
…continued C. Total Costs: Sum of fixed and variable costs. D. Marginal Costs: Extra cost incurred when a business produces one additional unit of a product. i. Increase of Total Variable costs divided by Marginal product. • This will be the amount it costs to produce one more unit. Page 128
II. Applying Cost Principles A. Self Service Gas Station i. Many pumps. Only one attendant who works in booth and takes money. • Large Fixed Costs such as pumps, tanks, rent, and taxes. • Small Variable costs such as hourly wage, electric bill, gas sold. ii. Owner may operate Gas Station 24/7 because costs are low.
III. Measures of Revenue - Businesses use two key measures of revenue to find what will produce greatest profit. 1. Total Revenue: number of units sold multiplied by the average price per unit. • Ex: If 7 units are sold are $15 a pop, the total revenue is $105. 2. Marginal Revenue: Extra revenue associated with the product and sale of one additional unit of output. • Found by dividing total revenue by marginal product. Page 130
5-3 EQ • What is the difference between a fixed cost and a variable cost? • Fixed: the cost that a business incurs even if it is idle and output is zero. • Variable: a cost that changes when the business rate of operation or output changes.
Chapter 5 The end