Download
1 / 18
180 likes | 193 Views
This presentation explores the effects of international trade on income distribution in the USA, focusing on the main issues, how trade occurs, and its effects on income distribution. It examines the increase in income inequality and stagnant wages in relation to globalization and trade.

E N D
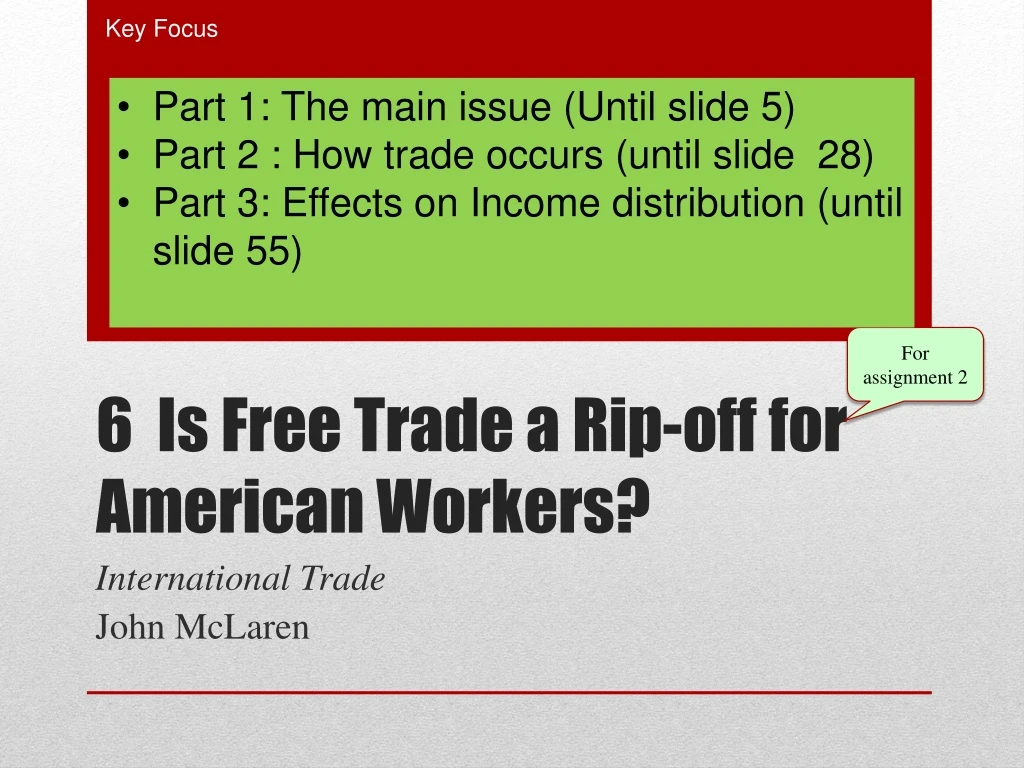
Key Focus • Part 1: The main issue (Until slide 5) • Part 2 : How trade occurs (until slide 28) • Part 3: Effects on Income distribution (until slide 55) For assignment 2 6 Is Free Trade a Rip-off for American Workers? International Trade John McLaren
This is what the USA Trump administration emphasises Four facts. Video links http://www.investopedia.com/video/play/income-inequality/ RMIT/ECON1089/July2016/ClareKon • Since the 1970’s, the US economy has grown quite well -- more than doubled, in fact. Along with this, labor productivity grew. (ie MP RISES ? ) • Over the same period, wages started to lag behind productivity growth.[ using w=p x mp); w should rise..unless p falls drastically? ] • INEQUALITY in wages also increased; median wages have been stagnant, and below-median male wages have fallen. • This coincides with the big wave of globalization (Income inequality is thus the harms of international trade) .
Step 1: Consider FACTOR INTENSITY Seems like producing plastic uses more inputs, so more effective to produce apparel? Ls/Lu is larger for plastic Plastic production is more skilled labour intensive You can also compare Lu/LS to discuss unskilled labour intensity • Produce 1 unit of apparel: Requires 1 unit of skilled labor and 2 units of unskilled labor. • Produce 1 unit of plastics: Requires 3 units of skilled and 3 units of unskilled labor. • Apparel is unskilled-labor intensive; plastics are skilled-labor intensive. • Note: Relative terms: comparison of skilled-to-unskilled labor ratio in the two industries.
How do we know the skills level of the workers? Step 2: consider FACTOR ENDOWMENT 1. Overall total L in China is larger 2. USA is skilled labour abundant China is unskilled labour abundant • Assume that the US has 72 million unskilled workers, 60 million skilled workers. • Assume that China has 540 million unskilled workers, 300 million skilled workers. Go to slide 13
China more unskilled labour + apparels require more unskilled labour USA more skilled labour + plastic requires more skilled labour
Use the activity coefficients for skilled in A and P (in slide 10) to get total demand for LS Do not worry too much about how the eqns are formed; focus on the concepts Production: US. • Unskilled labor market clearing • 2A + 3P = 72 million. --- (1) Labour demand = labour supply • Skilled labor market clearing: • A + 3P = 60 million. --- (2) • Two equations and two unknowns.
3. Slope = 2/3 Ie using unskilled labour: increase 1 P forgo 2/3 A • Lu= 72 = 2A+3P At P=0, max A produced = 72/2 2. At A=0, max P produced = 72/3
1. Slope = 1/3 Ie using skilled labour increase 1 P forgo 1/3 A 2. Compare to unskilled labour of oppt cost of 2/3A 3. We get the idea USA with more skilled labour has adv to produce more P At A=0, max P produced = 60/3 • Ls = 60m = A + 3P At P=0, max A produced =60/1
3. Ratio of A/P = 12/16 =3/4=0.75= RELATIVE SUPPLY USA should produce 12 units of A and 16 units of P Are we surprised with the results ? RMIT/ECON1089/July2016/ClareKon Go to slide 20
Double output Double BOTH inputs • Suppose we DOUBLEDthe endowment of both kinds of labor -- the relative supply of apparel would..... • ... not change.
Will we expect to see more units of A produced? Go to slide 24 Qn for thought: Does this shed light on SG immigration policy or USA to kick out illegal immigrants? USA is LESS skilled labour abundant OR MORE UNSKILLED ABUNDANT over time; {but can still be more skilled labour abundant compared to China • Therefore, we can think of RS as a function of LU/LSalone. • Now, is it increasing or decreasing in LU/LS? • I.e., what happens if we raise LU (e.g. to 80m) without changing LS (at 60m)?
Key learning point: change in factor endowment can affect a country's trade pattern. Using this intuition, we now consider trade btw USA and china RMIT/ECON1089/July2016/ClareKon • Answer: QA goes up, and QP goes down. • This is called the Rybczynski (“rib-chin-ski”) theorem. • Consequence: RS is increasing in LU/LS.
5. USA export P, import A, RS rises as A rises, P falls 6 . China with lower PA/PP , exporting A and import P. RS falls as A falls, P rises 4. USA faces higher PA/PP and has adv to export P 1 2 E 7. At E, RS=RD PA/PP = 0.42 **Computations not impt 8. Final equilibrium PA/PP *computation for relative price is not crucial 3. Assuming both China and USA share the same relative demand
So rapid expansion of plastic industry (hire for LS) But what about the declining sector threaten by imports and the LU? That is the key issue we trying to address !!!
At autarky : In we consume where we produce, this is at the orange point. • With trade, PA falls, Ws/PA and Wu/PA rises • Purchasing power for workers in plastic industry rises and line shift right 1 Exporting sector in USA 2 RMIT/ECON1089/July2016/ClareKon
2 4 1 3 5. Focus on the shift in purchasing power in the exporting sector The unskilled is worst off whilst the skilled is better off : Widen income inequality Go to slide 51)
In summary • USA: • More skilled labour abundant ; • export the skilled labour intensive goods • skilled labour better off, unskilled labour worst off • Worsens income inequality RMIT/ECON1089/July2016/ClareKon • The drop in PA/PP raises wS in terms of both goods, • and reduces wU in terms of both goods. • Put differently, the reduction in relative price of unskilled-intensive good hurts unskilled labor but benefits skilled labor. • Called the ‘Stolper-Samuelson theorem.’
In summary • China • More unskilled labour abundant ; • export the unskilled labour intensive goods • unskilled labour better off, skilled labour worst off • Narrows income inequality RMIT/ECON1089/July2016/ClareKon • We know that the US gains from trade. • I.e., pie is bigger. • But the unskilled workers’ share is smaller by enough that the absolute size of their piece of pie is now smaller. • Note: the opposite happens in China.


