Download
1 / 20
200 likes | 228 Views
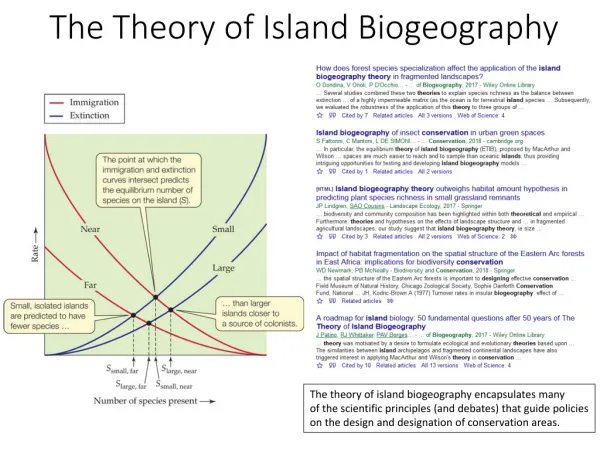
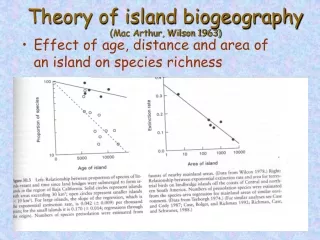
Theory of island biogeography (Mac Arthur, Wilson 1963). Effect of age, distance and area of an island on species richness. Generalization [to be seen in each textbook]. Results in classical species area relationship for islands (usually steeper then within a mainland).

E N D
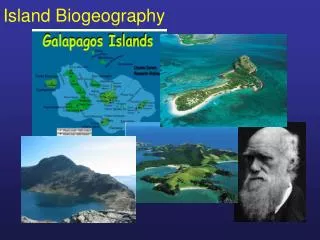
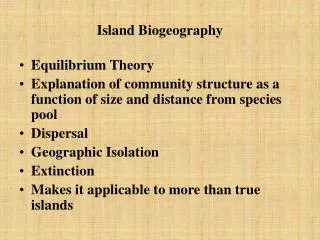
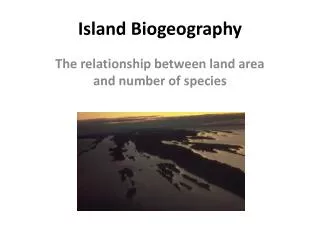
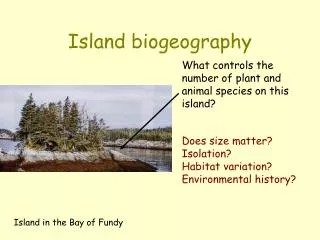
Theory of island biogeography(Mac Arthur, Wilson 1963) • Effect of age, distance and area of an island on species richness
Results in classical species area relationship for islands (usually steeper then within a mainland) Reptiles and amphibians – from Wikipedia
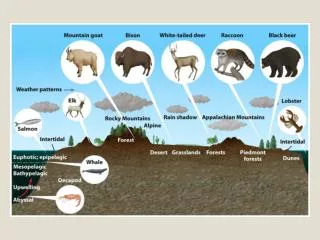
Geography • Decrease with increasing latitude (will be discussed by Vojta Novotný) • Historical causes – glacial periods in temperate • Europe –mountain ridges in E-W direction – barrier for migration – less species • Physiological limitation – tropical species are not able to grow in temperate climate
Tree species richness in Canada and the United States. Contours connect points with the same approximate number of species per quadrat. Quadrat size is 2.5˚ x 2.5˚ south of 50˚N, and 2.5˚ x 5˚ north of 50˚N (Currie and Paquin 1987).
Medium disturbance hypothesis – is reflected in successional gradients
Changes in species richness during an old-field succession, measured on various spatial scales. The numbers on the right side are sizes of sampling plots expressed as the lengths of the quadrat side. From Osbornová et al. 1990.
Generality of unimodal (humpedback) model? – Problems with scale and extend Diversity on productivity gradients
Examples of unimodal relationships between species richness and measures of habitat productivity in plant communities. P* and K* are normalised concentrations of soil phosphorus and potassium, which were summed to give an index of soil fertility. From Tilman and Pacala (1993), where also the references to original source can be found.
Fraser et al. Worldwide evidence of a unimodal relationship between productivity and plant speciesrichness. - SCIENCE · JULY 2015 - but richness depends on productivity!!!!! – X, Y axis
Skácelová & Lepš, 2014, Hydrobiologia Phytoplankton diversity Relationship between log (biovolume [lm3/ml]) and indices of Hill’s series: N0, the number of species, N1, antilog of Shannon diversity, eH, N2, reciprocal of Simpson index of dominance, and N?, reciprocal of Berger–Parker index of dominance, fitted by GAM.
In benign environment, diversity decreases with productivity – why? Mown wet meadows under fertilization and dominant removal
Why the number of species decreases with productivity? • 1. Species pool hypothesis – there have been not many habitats with such a high productivity (at least grasslands) • But – most mesotrophic species are able to grow in productive habitats – so the evolutionary adaptatioh here must include also adaptation to biotic interactions
Why the number of species decreases with productivity? • 2. Biotic interactions (competition) within the community
Is competition higher in more productive environment? • Tilman: no, it is only change from underground to aboveground competition • Grime: Yes, competition increases in fertile environment. • Each of them defines and measures competition in different way
“Tilmanian” explanation • Rate of competitive exclusion depends not only on intensity,but also on competition asymmetry. In productive environment, competition for light, which is more asymmetric, prevails, and so the faster competitive exclusion.
Ohrazeni experiment – best predictor for success under fertilization is plant height
“Grimean” explanation • With increasing productivity, the rate of all processes and intensity of competition increases.