Understanding Warm Fronts and Mixed Phase Precipitation Dynamics
This resource explores warm fronts and their associated mixed phase precipitation events using data from the University of Illinois WW2010 Project. It covers key concepts such as temperature profiles linked to precipitation types, the warm and cold conveyor belt models, and the role of latent heat in phase transitions. Diagnostic techniques like Doppler radar readings are also discussed, emphasizing the importance of monitoring changes in temperature, virga, and precipitation types as warm fronts approach. Ideal for meteorology students and professionals seeking insights into precipitation mechanics.


Understanding Warm Fronts and Mixed Phase Precipitation Dynamics
E N D
Presentation Transcript
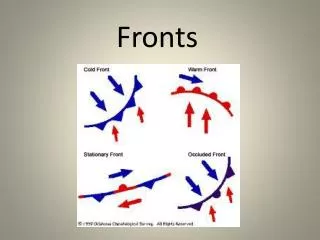
Warm Fronts Mixed Phase Case
Credits • "Image/Text/Data from the University of Illinois WW2010 Project • http://ww2010.atmos.uiuc.edu/(Gh)/home.rxml • MetED : Freezing and Melting, Precipitation Type and NWP • Gary Lackmann • The Radar Palette • Phil Chadwick
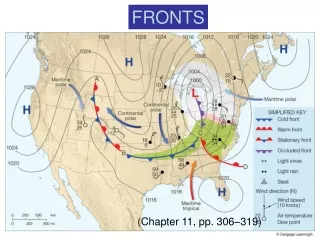
Outline • Warm fronts and the Warm Conveyor Belt • Typical precipitation phase transitions • Temperature profiles associated with these precipitation types. • Latent heat effects on profiles and phase changes. • Approaching warm fronts as seen on Doppler radial velocity displays. • Case study of a mixed phase event.
R IP S ZR
B Warm Frontal Cross-section along Trailing Branch of the Warm Conveyor Belt (WCB) A Virga unlikely except along the leading edge of the WCB WCB WCB oriented for maximum frontal lift Virga Precipitation Increasing CCB Moistening Lower Hydrometeor Density Mixing Zone Precipitation At Surface Surface Warm Front CCB B A Cold air in Cold Conveyor Belt (CCB) even more shallow and more moist Moist portion of Warm Conveyor Belt (WCB) is thicker, higher and backed from frontal perpendicular – anabatic tendency Lower levels of WCB have the same origin as the upper level of the WCB WCB probably backs slightly with height in spite of the warm air advection. A greater WCB depth is frontal perpendicular Frontal slope likely steeper than the typical 1:200 Precipitation extends further into the moistened, modified CCB. Horizontal rain area expands rapidly as CCB moistened.
R IP S ZR Lets look at temperature profiles as we move towards the warm front in the cold air.
The Wonders of Latent Heat • Melting Snow Cools the Above Freezing level aloft • The Freezing of Rain warms the Above freezing Level near the surface
Doppler Radar and Winter Warm Fronts • Conceptual model of the warm and cold conveyor belts implies certain patterns on a Doppler radial velocity display
Y A B X
Warm fronts and Precipitation Phase • Warm Fronts • From radial velocity patterns • Depth of cold air • Nowcasting of Temperature Advections • Changes in Strength of low level flow. • From logz and cross sections • bright band • Freezing level, lowest extent of melting snow Possibility ZR IP at the surface
Two Different Warm Fronts It’s “What Lies Beneath” That Counts.
Combining Doppler Pattern and Bright Band A Warm Frontal Wave
X 18Z Feb 13
Big Changes in 7 hours as this wave approaches. • Can you identify the warm conveyor belt at 13z… at 20z What changes occur? • The Cold Conveyor Belt? • What does this mean for the track of the wave approaching?
Y B A A X
Y B A X
What happens between 1800z and 1900z • What do you expect from surface observations near the radar. Remember YFC (just west of radar) was Minus 6 C at 1800z?
YFC/YQM obs Feb 13 2008 YFC YQM