Download
1 / 22
240 likes | 389 Views
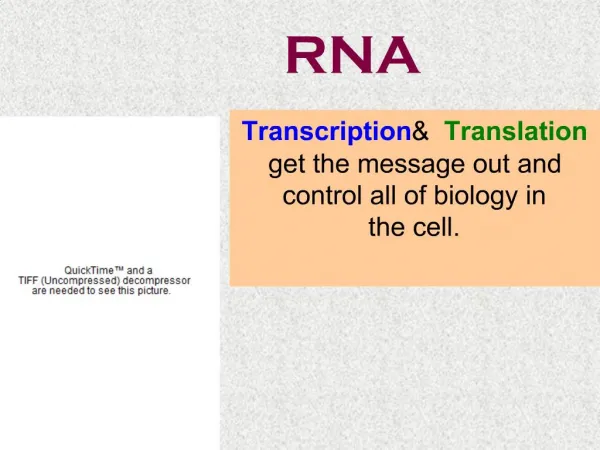
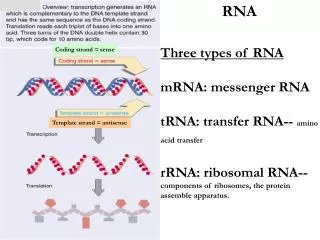
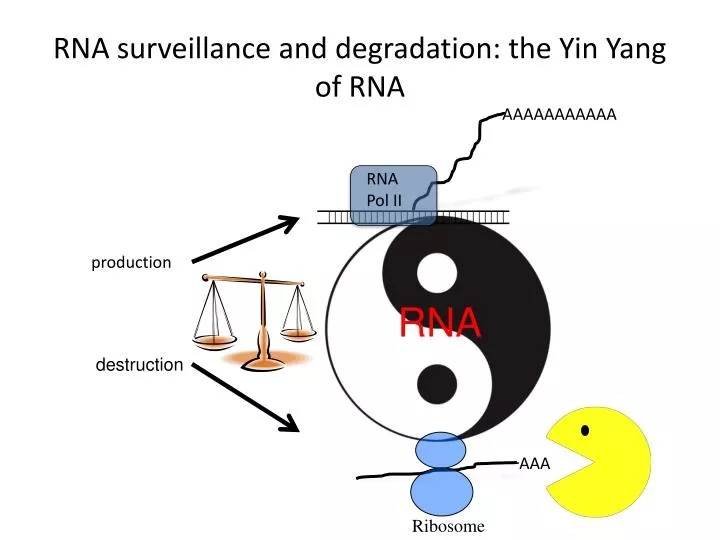
RNA surveillance and degradation: the Yin Yang of RNA. AAAAAAAAAAA. RNA Pol II. production. RNA. destruction. AAA. Ribosome. *. *. *. *. *. *. *. *. *. *. *. *. MODEL:. Mtr4. Polyadenylation by Trf4p. Trf4p. AAAAA. Hypomodified tRNA i Met. *. Rrp46p. Csl4p. Rrp43p.

E N D
RNA surveillance and degradation: the Yin Yang of RNA AAAAAAAAAAA RNA Pol II production RNA destruction AAA Ribosome
* * * * * * * * * * * * MODEL: Mtr4 Polyadenylation by Trf4p Trf4p AAAAA Hypomodified tRNAiMet * Rrp46p Csl4p Rrp43p AAAAA Rrp45p Rrp42p Rrp44p Exosome Mtr3p Rrp41p Rrp4p Rrp6p Rrp40p Degradation of hypomodified tRNAiMet *- Hypothetical diagram of the exosome
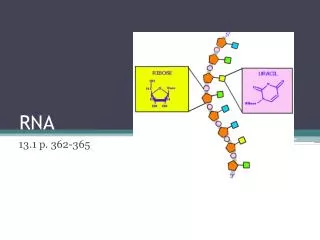
Next Gen sequencing PolyA-Seq TRAMP Complex AAAA AAAA AAAA AAAA AAAA Papd5 Mtr4 ZCCHC7 AAAA AAAA siRNA knockdown
Map paired end reads to genome • BWA (Burrows-Wheeler Aligner) Algorithm used to map each pair of reads to the genome • Report each pair of reads as a single nucleotide position within the genome where polyadenylation detected in an RNA sample • Average insert size 300 • Read size ~45 AAAA-3’ 3’-A TTTp-5’
Raw reads vs Mapped reads Normalization of data: reads per million (rpm)
Analysis • Starting with refseq database • Raw read counts converted to reads per million • Reads at position/total reads in sample • Remove all non-coding RNAs • From each sample collect normalized reads mapping at the 3’ end +/- 50 bases of each refseq encoding protein • Dot Plot normalized reads on log scale, X axis=control and Y axis=mMtr4KD
mRNA polyadenylation does not change between Mtr4 and control KD R2=0.95141
Problems encountered • Sequencing read depth very different in the original data • 34 mil mapped reads in one sample 8 mil in other • Lack of 3 replicates for robust statistical analysis of data • Removal of internal A • Seq reads that map to a oligoadenylate track in the genome • Algorithm developed misses many • Manual removal takes too much time.
Remove Internal A AAAAAAAA AAAAAAAA TTTTTTTTT TTTTTTTTT
How to mine the data based on a hypothesis • Hypothesis: PolyA+ RNAs of unknown identity will accumulate upon depletion of mMtr4 vs. the control. • How can the transcriptome be queried? • How detailed should a query be? • Every pA position, or only those exhibiting greater than x number of raw/normalized reads? • How do we find significant differences with one sample, or possibly two? • How can repetitive elements be accounted for in the data?
Custom annotation to remove bias from existing annotations • Data mapped with Bowtie to mouse genome mm10 build • Mapped data from KD and control compared using cufflinks to explore gene expression differences using a custom annotation • Custom annotation • 1000 base pair genes with 500 base pair overlap with next gene • This did not work well
Problems with using custom annotation • First real problem was the no computing could handle more than 5000 genes of the custom annotation at a time • One chromosome had 147K genes • There was a problem with assignment when the reads overlapped • Cuffdiff would randomly assign the reads to only one of the genes. • Overlaps split into two fasta files, but we could not capture differences in the data that we knew exists. • cuffdiff collects data from the entire 1000 bp gene and compares between 2 samples • This method leads to false negatives for pA data where the focus is on one or a few positions as a pA event.
F-Seq • Tags to identify specific sequence features for different library preparations (ChIP-seq), (DNase-seq) and (pA-seq). • Will summarize and display individual sequence data as an accurate and interpretable signal, by generating a continuous tag sequence density estimation.
Generating Peaks with FSeq • 1. Estimate kernel density to estimate pdf • 2. compute threshold • nw=nw/L. • xc, • Repeat step 2 ktimes • s SDs above the mean • 2.1 threshold output module is modifiable
Magnitude of data: one sample both strands 51 million bases of Chromosome 12 12 thousand bases of Chromosome 12 Chromsome 12 is 121 million base pairs long
pA reads intersecting 45S pre-rRNA 18S 5.8S 28S
pA reads intersecting 45S pre-rRNA 18S 5.8S 28S
Accumulation of micro RNA processed 5’ leader upon depletion of Mtr4 • Comparison of Mtr4 V. Control KD • Abundant polyA found near 5’ end of annotated Mir322 • Confirmed using molecular technique