Download
1 / 22
220 likes | 248 Views
Explore data on mortality, uninsured rates, access problems, preventive care receipt, and chronic condition management highlighting disparities in the U.S. healthcare system from 2001 to 2006. Understand the impact of income, insurance status, and race/ethnicity on healthcare outcomes.

E N D
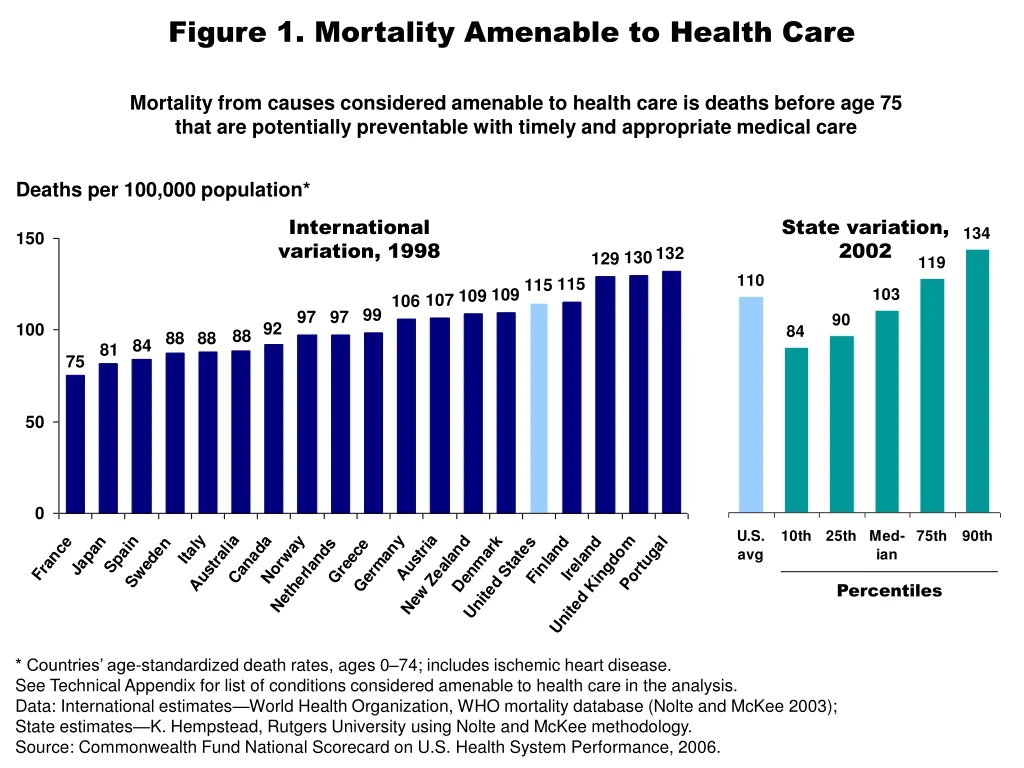
Figure 1. Mortality Amenable to Health Care Mortality from causes considered amenable to health care is deaths before age 75 that are potentially preventable with timely and appropriate medical care Deaths per 100,000 population* International variation, 1998 State variation,2002 Percentiles * Countries’ age-standardized death rates, ages 0–74; includes ischemic heart disease. See Technical Appendix for list of conditions considered amenable to health care in the analysis. Data: International estimates—World Health Organization, WHO mortality database (Nolte and McKee 2003); State estimates—K. Hempstead, Rutgers University using Nolte and McKee methodology. Source: Commonwealth Fund National Scorecard on U.S. Health System Performance, 2006.
Figure 2. Infant Mortality Rate, 2002 Infant deaths per 1,000 live births International variation State variation Percentiles * 2001. Data: International estimates—OECD Health Data 2005; State estimates—National Vital Statistics System, Linked Birth and Infant Death Data (AHRQ 2005a). Source: Commonwealth Fund National Scorecard on U.S. Health System Performance, 2006.
Figure 3. Uninsured Rates High Among Adults with Low and Moderate Incomes, 2001–2005 Percent of adults ages 19–64 53 52 49 41 35 28 28 26 24 18 16 13 7 4 4 2001 2003 2005 2001 2003 2005 2001 2003 2005 2001 2003 2005 2001 2003 2005 Total Low income Moderate income Middle income High income Note: Income refers to annual income. In 2001 and 2003, low income is <$20,000, moderate income is $20,000–$34,999, middle income is $35,000–$59,999, and high income is $60,000 or more. In 2005, low income is <$20,000, moderate income is $20,000–$39,999, middle income is $40,000–$59,999, and high income is $60,000 or more. Source: S.R. Collins et al., Gaps in Health Insurance Coverage: An All-American Problem, Findings from the Commonwealth Fund Biennial Health Insurance Survey, The Commonwealth Fund, April 2006.
Figure 4. Adults Ages 19–64 Who Are Uninsuredand Underinsured, by Poverty Status, 2003 * Underinsured defined as insured all year but experienced one of the following: medical expenses equaled 10% or more of income; medical expenses equaled 5% or more of incomes if low-income (<200% of poverty); or deductibles equaled 5% or more of income. Data: 2003 Commonwealth Fund Biennial Health Insurance Survey (Schoen et al. 2005b). Source: Commonwealth Fund National Scorecard on U.S. Health System Performance, 2006.
Figure 5. Access Problems Because of Costs in Five Countries, Total and by Income, 2004 Percent of adults who had any of three access problems* in past year because of costs * Did not get medical care because of cost of doctor’s visit, skipped medical test, treatment,or follow-up because of cost, or did not fill Rx or skipped doses because of cost. UK=United Kingdom; CAN=Canada; AUS=Australia; NZ=New Zealand; US=United States. Data: 2004 Commonwealth Fund International Health Policy Survey of Adults’ Experiences with Primary Care (Schoen et al. 2004; Huynh et al. 2006). Source: Commonwealth Fund National Scorecard on U.S. Health System Performance, 2006.
Figure 6. Receipt of All Three Recommended Servicesfor Diabetics, by Race/Ethnicity, Family Income, Insurance,and Residence, 2002 Percent of diabetics (ages 18+) who received HbA1c test, retinal exam, and foot exam in past year * ** * Insurance for people ages 18–64. ** Urban refers to metropolitan area >1 million inhabitants; Rural refers to noncore area <10,000 inhabitants. Data: 2002 Medical Expenditure Panel Survey (AHRQ 2005a). Source: Commonwealth Fund National Scorecard on U.S. Health System Performance, 2006.
Figure 7. Adults Without Insurance Are Less Likelyto Be Able to Manage Chronic Conditions Percent of adults ages 19–64 with at least one chronic condition* *Hypertension, high blood pressure, or stroke; heart attack or heart disease; diabetes; asthma, emphysema, or lung disease. Source: S. R. Collins, K. Davis, M. M. Doty, J. L. Kriss, A. L. Holmgren, Gaps in Health Insurance: An All-American Problem, Findings from the Commonwealth Fund Biennial Health Insurance Survey (New York: The Commonwealth Fund, Apr. 2006).
Figure 8. Receipt of Recommended Screening and Preventive Care for Adults, by Family Income and Insurance Status, 2002 Percent of adults (ages 18+) who received all recommended screening and preventive care within a specific time frame given their age and sex* * Recommended care includes seven key screening and preventive services: blood pressure, cholesterol, Pap, mammogram, fecal occult blood test or sigmoidoscopy/colonoscopy, and flu shot. Data: B. Mahato, Columbia University analysis of 2002 Medical Expenditure Panel Survey. Source: Commonwealth Fund National Scorecard on U.S. Health System Performance, 2006.
Figure 9. Preventive Care Visits for Children, by Top and Bottom States, Race/Ethnicity, Family Income, and Insurance, 2003 Percent of children (ages <18)received BOTH a medical and dental preventive care visit in past year Data: 2003 National Survey of Children’s Health (HRSA 2005; retrieved from Data Resource Center for Child and Adolescent Health database at http://www.nschdata.org). Source: Commonwealth Fund National Scorecard on U.S. Health System Performance, 2006.
Figure 10. Children with a Medical Home, by Top and Bottom States, Race/Ethnicity, Family Income, and Insurance, 2003 Percent of children who have a personal doctor or nurse and receive care that is accessible, comprehensive, culturally sensitive, and coordinated* * Child had 1+ preventive visit in past year; access to specialty care; personal doctor/nurse who usually/always spent enough time and communicated clearly, provided telephone advice or urgent care and followed up after the child’s specialty care visits. Data: 2003 National Survey of Children’s Health (HRSA 2005; retrieved from Data Resource Center for Child and Adolescent Health database at http://www.nschdata.org). Source: Commonwealth Fund National Scorecard on U.S. Health System Performance, 2006.
Figure 11. Test Results or Medical Record Not Availableat Time of Appointment, Among Sicker Adults, 2005 Percent reporting test results/records not available at time of appointment in past two years International comparison United States, by race/ethnicity, income, and insurance status GER=Germany; AUS=Australia; NZ=New Zealand; UK=United Kingdom; CAN=Canada; US=United States. Data: Analysis of 2005 Commonwealth Fund International Health Policy Survey of Sicker Adults; Schoen et al. 2005a. Source: Commonwealth Fund National Scorecard on U.S. Health System Performance, 2006.
Figure 12. Duplicate Medical Tests, Among Sicker Adults, 2005 Percent reporting that doctor ordered test that had already been done in past two years United States, by race/ethnicity, income, and insurance status International comparison UK=United Kingdom; NZ=New Zealand; CAN=Canada; AUS=Australia; US=United States; GER=Germany. Data: Analysis of 2005 Commonwealth Fund International Health Policy Survey of Sicker Adults; Schoen et al. 2005a. Source: Commonwealth Fund National Scorecard on U.S. Health System Performance, 2006.
Figure 13. Health Expenditure Growth 2000–2005for Selected Categories of Expenditures Average annual percent growth in health expenditures, 2000–2005 Source: A. Catlin et al., “National Health Spending in 2005: The Slowdown Continues,”Health Affairs, Jan./Feb. 2007 26(1):142–53.
Figure 14. Percentage of National Health ExpendituresSpent on Health Administration and Insurance, 2003 Net costs of health administration and health insuranceas percent of national health expenditures a b c * a2002 b1999 c2001 *Includes claims administration, underwriting, marketing, profits, and other administrative costs;based on premiums minus claims expenses for private insurance. Data: OECD Health Data 2005. Source: Commonwealth Fund National Scorecard on U.S. Health System Performance, 2006.