Download
1 / 12
120 likes | 225 Views
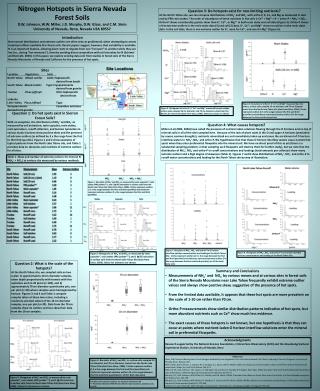
ESRM 410 Forest Soils and Site Productivity 2013. Nutrient Limitation ‘What if Scenario’ . Cedar River Watershed – plots just located upstream of ‘you are here’ pointer.

E N D
ESRM 410 Forest Soils and Site Productivity2013 Nutrient Limitation ‘What if Scenario’
Cedar River Watershed – plots just located upstream of ‘you are here’ pointer
This slide and some following contain the design, stand characteristics and initial growth results. Please concentrate on explaining factors that might have led to: • the differential growth of Douglas-fir vs. red alder on each site and also • the differential growth of each species on different initial site Figure 1. Layout of study.
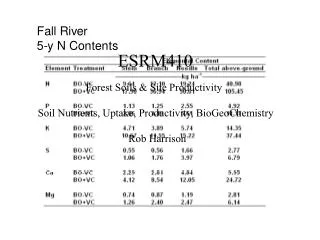
Table 2. Stand C distribution in the 50-yr-old Douglas fir and red alder stands. Tree and understory C concentrations were assumed to be 500 mg C kg-1. Where possible from sampling procedure, variability between plots was assessed and means compared via two-tailed two-sample t-test (Freund, 1988).
DF - RA RA - RA RA - DF DF - DF Figure 2. Growth of new plantations.
Please concentrate on explaining factors that might have led to: • the differential growth of Douglas-fir vs. red alder on each site,and also • the differential growth of each species on different initial site So, the these groups will respond to the above questions with the following comparisons:(many other comparisons can be made but just concentrate on answering the questions related to these forest plots) Group 1 will compare = RA-RA vs. DF-RA Group 2 will compare = RA-DF vs.DF-DF Figure 1. Layout of study.