Scatter Graphs & Correlations: Interpretation Guide
Learn how to produce, describe, and interpret scatter graphs, correlation, and lines of best fit. Understand positive, negative, and no correlation, as well as the significance of the line of best fit in predictions. Explore examples and discussions on correlation versus causation.

Scatter Graphs & Correlations: Interpretation Guide
E N D
Presentation Transcript
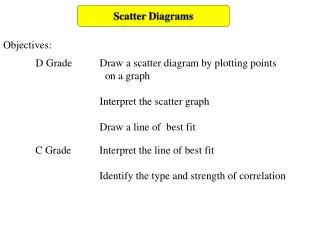
Scatter-graphs How to produce, describe and interpret a scatter-graph - Correlation - Line of Best Fit
As one goes up... The other goes up Positive correlation
As one goes up... The other goes down Negative correlation
No correlation Perfect positive correlation Weak negative correlation Weak positive correlation
No correlation No correlation
Line of Best Fit • “A line as close as possible to all points” • How? • 1) The line should have an equal number of points either side of it. • The line should go through • the mean point • (x-coordinate: mean of all x values, y-coordinate: mean of all y values) Optional
Line of Best Fit “A line as close as possible to all points” Why? The line can be used to predict values: Interpolation: Predicting values within the range covered. Extrapolation: Predicting values outside the range covered.
Line of Best Fit “Post hoc, ergo propter hoc” “After it, therefore because of it” Rarely true Just because two things are correlated doesn’t mean one causes the other.
Discuss “If you spend a lot of time on the phone, you have a better chance of ending up in a high-paying job” “The larger your shoe-size, the greater your bank overdraft” “Learning maths makes you a better musician”
Positive, Negative or None? Remember: correlation doesn’t mean one thing causes the other – it just means there is a relationship between them. Time spent travelling Distance covered Level of education Level of income Amount of clothing worn Temperature outside Number of pages in a book Copies sold Cost of car insurance Age of driver Number of socks owned Number of cars owned