Download

1 / 20
210 likes | 435 Views
The Integral And The Area Under A Curve. How do we find the area between a curve and the x- axis from x = a to x = b ?. We could approximate it with rectangles:. We could use more than one rectangle to approximate the area.

E N D
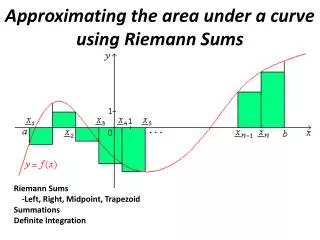
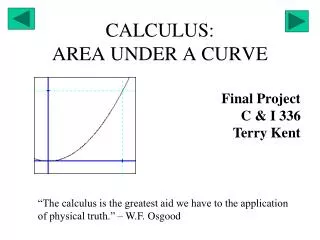
The Integral And The Area Under A Curve
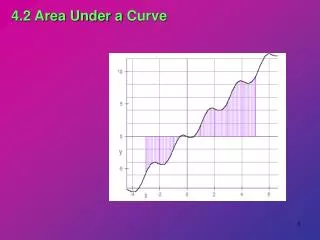
How do we find the area between a curve and the x-axis from x = a to x = b?
We could use more than one rectangle to approximate the area
Area under the curve is approximately equal to the sum of the areas of the rectangles. More rectangles = better approximation of Area
Here’s a demonstration of how the approximation works: http://www.slu.edu/classes/maymk/Riemann/Riemann.html
Riemann Sums Riemann Sums help us to make the calculation of the area under a curve more uniform (or easier):
Riemann Sums • First divide the interval into equal parts • Then we choose a point in each interval to make a rectangle • Use the chose x* value to find the height of each rectangle by simply finding f(x*) for each interval.
Riemann Sums We can use the right endpoints of each subinterval as the x*
Riemann Sums Or we can use the left endpoints of each subinterval as the x*
Riemann Sums Or we can use the midpoints of each subinterval as the x*
Riemann Sums Using left endpoints, our calculations, we proceed as follows: Width of each rectangle: In this case: In general:
Riemann Sums Using left endpoints, our calculations proceed as follows: Height of each rectangle = For example, the height of the third rectangle is: Area of each rectangle =
Riemann Sums Using right endpoints, our calculations, we proceed as follows: Width of each rectangle: In this case: In general:
Riemann Sums Using right endpoints, our calculations proceed as follows: Height of each rectangle = For example, the height of the fourth rectangle is: Area of each rectangle =
Riemann Sums Using midpoints, our calculations, we proceed as follows: Width of each rectangle: In this case: In general:
Riemann Sums Using midpoints, our calculations proceed as follows: Height of each rectangle = For example, the height of the second rectangle is: Area of each rectangle =
The greater the value of n used, then the better the approximation of the area will be: We say: Note: Depends on whether we use left endpoints, right endpoints, or midpoints.
Here’s another demonstration of how the approximation works: http://www.slu.edu/classes/maymk/Riemann/Riemann.html