Download
1 / 1
20 likes | 305 Views
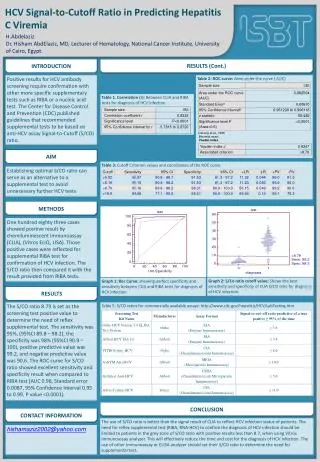
HCV Signal-to-Cutoff Ratio in Predicting Hepatitis C Viremia. H.Abdelaziz Dr. Hisham AbdElaziz, MD, Lecturer of Hematology, National Cancer Institute, University of Cairo, Egypt. RESULTS ( Cont .). INTRODUCTION.

E N D
HCV Signal-to-Cutoff Ratio in Predicting Hepatitis C Viremia H.Abdelaziz Dr. Hisham AbdElaziz, MD, Lecturer of Hematology, National Cancer Institute, University of Cairo, Egypt. RESULTS (Cont.) INTRODUCTION Positive results for HCV antibody screening require confirmation with other more specific supplementary tests such as RIBA or a nucleic acid test. The Center for Disease Control and Prevention (CDC) published guidelines that recommended supplemental tests to be based on anti-HCV assay Signal-to-Cutoff (S/CO) ratio. Table 2: ROC curve: Area under the curve ( AUC) DeLong et al., 1988 Binomial exact Youden index Table 1. Correlation (r): Between CLIA and RIBA tests for diagnosis of HCV infection AIM Table 3: Cutoff Criterion values and coordinates of the ROC curve Establishing optimal S/CO ratio can serve as an alternative to a supplemental test to avoid unnecessary further HCV tests. METHODS One hundred eighty three cases showed positive result by chemiluminescent immunoassay (CLIA), (VitrosEciQ, USA). Those positive cases were reflected for supplemental RIBA test for confirmation of HCV infection. The S/CO ratio then compared it with the result provided from RIBA tests. RESULTS Graph 2: S/Co ratio cutoff value: Shows the best sensitivity and specificity of CLIA S/CO ratio for diagnosis of HCV infection. Graph 1: Roc Curve: showing perfect specificity and sensitivity between CLIA and RIBA tests for diagnosis of HCV infection The S/CO ratio 8.79 is set as the screening test positive value to determine the need of reflex supplemental test. The sensitivity was 95%, (95%CI 89.8 – 98.2), the specificity was 98% (95%CI 90.9 – 100), positive predictive value was 99.2, and negative predictive value was 90.6. The ROC curve for S/CO ratio showed excellent sensitivity and specificity result when compared to RIBA test (AUC 0.98, Standard error 0.0087, 95% Confidence Interval 0.95 to 0.99, P value <0.0001). Table 5: S/CO ratios for commercially available assays: http://www.cdc.gov/hepatitis/HCV/LabTesting.htm CONCLUSION CONTACT INFORMATION The use of S/CO ratio is better than the signal result of CLIA to reflect HCV infection status of patients. The need for reflex supplemental test (RIBA, RNA-HCV) to confirm the diagnosis of HCV infection should be limited to patients in the grey zone of S/CO ratio with positive results less than 8.7, when using Vitros Immunoassay analyzer. This will effectively reduce the time and cost for the diagnosis of HCV infection. The use of other Immunoassay or ELISA analyzer should set their S/CO ratio to determine the need for supplemental test. hishamaziz2002@yahoo.com