Molecular Modelling
200 likes | 365 Views
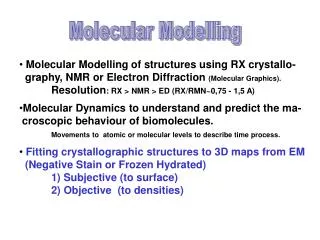
Molecular Modelling. Molecular Modelling of structures using RX crystallo- graphy, NMR or Electron Diffraction (Molecular Graphics). Resolution : RX > NMR > ED (RX/RMN~0,75 - 1,5 A)

Molecular Modelling
E N D
Presentation Transcript
Molecular Modelling • Molecular Modelling of structures using RX crystallo- graphy, NMR or Electron Diffraction (Molecular Graphics). Resolution: RX > NMR > ED (RX/RMN~0,75 - 1,5 A) • Molecular Dynamics to understand and predict the ma- croscopic behaviour of biomolecules.Movements to atomic or molecular levels to describe time process. • Fitting crystallographic structures to 3D maps from EM (Negative Stain or Frozen Hydrated) 1) Subjective (to surface) 2) Objective (to densities)
Image Processing Visually enhance (subjective) or statistically (objective) evaluate some aspect of an image not apparent in its original form. • Optical Processing. Uses optics to carry out a process.Eyeglasses, Darkroom • Analog Processing. Refers to the alteration of images through electrical means. Brightness and contrast controls on a TV • Digital Image Processing Same as above but on a computer One picture is worth more than ten thousand words
History A digital picture produced in 1920 from a coded tape by telegraph printer with special type faces. Transmitted via submarine cable from London to New York for newspapers Cable picture transmitted by 15-tone equipment from London to New York in 1929
The Digital Image Processing System Mass Storage Image Digital Computer Operator Console Digitizer Display
The Digital Image Processing System Image Digitizer • Microdensitometers: Negatives or photographs are scanned by light beam recording the gray level either by transmission or by reflection. • Flat bed (scanners) • Wrapped around a drum • Digital sensors: Remote sensors used by satellite surveillance • Video scanners: Use a video camera to acquire the image to be converted to a digital image.
Image Adquisition A/D Converter“Quantization” • The digital image processor converts a continuous tone image to discrete points of information (sampling quantization or digitizing). • A sample point is referred to as a picture element or pixel. • An image is digitized into a grid of pixels (n columns & m rows) • Each pixel is a number (digital), that represents the brightness of the original picture.
Origin Digital Image • Two dimensional light intensity function f(x,y), where x andydenote spatial coordinates and the value of f at any point (x,y) is proportional to the brightness (or gray level) of the image at that point. Image elements, picture elements, pixels or pels
Spatial Resolution • Describe how many pixels an image is divided into. • The finer the resolution, the closer we approach to the appearance of the original image. Units: DPI, PPI Spatial Frequency • The rate at which brightness of an image changes from dark to light. Details range from minutely detailed in space cloth or moon surface to smooth varying shades in the overall scene.
Brightness Resolution • This is concerned with how accurately the digital brightness of each pixel resembles the original brightness. • The number of gray levels (G) can be represented in each pixel. • G= 2m • G=2 means m=1; G=8 means m=3; G=256 means m=8
Brightness Resolution • How many gray levels can see a human been? • The human vision is a result of a combination of brightness adaptation and contrast sensitivity of the eye. • Experimentally the human eye can detect only one or two dozen in intensity levesl, but to obtain a display that will appear reasonably smooth to the human eye a range over 100 intensity levels is generally required.
Image Histogram • A histogram of gray levels provides a global description of the appearance of an image. • N(b) is a function of the number of pixels (N) with the same gray level (b).
Discontinuous Helices Helical repeat 43.5nm = 43.5nm/14.5nm=3 =14.5nm Sub-units separation =14.5nm 1/p Subunits separation • The myosin heads on the surface of myosin filament are arranged with helical geometry. • In Tarantula muscle they form 4 helices with a helical repeat of 43.5nm, and a separation between sub-units of 14.5nm Subunits separation 1/43.5nm-1=0.023nm-1= =1/14.5nm-1 1/P Helical repeat
Fourier Transform F(u) = ƒ(x) exp[-j2x] dx - One-dimensional Two-dimensional
Discontinuous Helices Helical repeat 43.5 nm = 43.5nm/14.5nm=3 =14.5 nm Subunits separation =14.5 nm 1/p Subunits separation Subunits separation 1/43.5nm-1=0.023nm-1= =1/14.5nm-1 1/P Helical repeat
Lowpass Filter • Ideal lowpass filter:All the frequencies inside a circle of radius D0 are passed with no attenuation, while all frequencies outside this circle are completely attenuated. • Trapezoidal lowpass filter • Butterworth lowpass filter • Exponential lowpass filter
Lowpass Filter 90; 95; 98; 99; 99.5; 99.9%
Lowpass Filter Ideal 90; 95; 98; 99; 99.5; 99.9%