Advanced Techniques for Water Pollution Prediction and Management
Explore predictive models and statistical analyses to monitor water pollution and quality, aiding in conservation strategies and informed decision-making. Key techniques like RIVPACS and multivariate analysis enhance environmental monitoring for sustainable resource management.

Advanced Techniques for Water Pollution Prediction and Management
E N D
Presentation Transcript
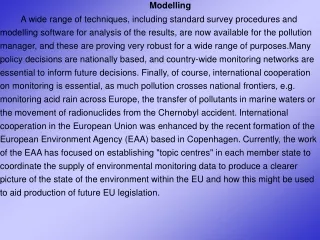
Modelling A wide range of techniques, including standard survey procedures and modelling software for analysis of the results, are now available for the pollution manager, and these are proving very robust for a wide range of purposes.Many policy decisions are nationally based, and country-wide monitoring networks are essential to inform future decisions. Finally, of course, international cooperation on monitoring is essential, as much pollution crosses national frontiers, e.g. monitoring acid rain across Europe, the transfer of pollutants in marine waters or the movement of radionuclides from the Chernobyl accident. International cooperation in the European Union was enhanced by the recent formation of the European Environment Agency (EAA) based in Copenhagen. Currently, the work of the EAA has focused on establishing "topic centres" in each member state to coordinate the supply of environmental monitoring data to produce a clearer picture of the state of the environment within the EU and how this might be used to aid production of future EU legislation.
predictive model The use of a , which take into consideration both the biotic and physicochemical approach for the detection of water pollution and monitoring of the water quality, is probably the best tool for the management and improvement of water resources, and especially of rivers. A predictive model, applied on data collected with a standard sampling method, can also produce a classification scheme according to the degree of pollution that rivers receive. This may allow inter and intra site comparisons, which could lead to an effective conservation strategy. For the establishment of these models, one approach is to identify the "best achievable community" which can occur under a particular set of physical, chemical, geological and geographical conditions. So the surveyed community can then be compared with the above one and hence the degree of change objectively assessed.
During the 70's, multivariate analytical techniques have been introduced as a new tool for the assessment of water quality. Between 1978 and 1988, in the UK a biological classification of unpolluted freshwater sites (483 sites on 80 rivers, 700 have been assessed up today) was developed based on macroinvertebrate fauna (see 5.1.3.). It was attempted to assess whether the type of macroinvertebrate community at a given site maybe predicted using physicochemical parameters. This proved to be feasible and led to the formation of RIVPACS (River InVertebrate Prediction And Classification System). Two main techinques are used for RIVPACS: Twinspan and Decorana.
Twinspan (two way indicator species analysis) classifies organisms at each site into an hierarchy on the basis of their taxonomic composition. At the same time, species are classified on the basis of their occurrence in site groups (sites are classified into 10-25 groups). It also identifies indicator species that show the greatest difference between site-groups in the frequency of occurrence (Figure 1). A common problem in community ecology and ecotoxicology is to discover how a multitude of species respond to external factors such as environmental variables, pollutants and management regimes. For this, data are collected (species and external variables) at a number of points in space and time. Decorana (detrended correspondence analysis) is an ordination technique which arranges sites into a subjective order, those sites with similar biota being placed close together. It also relates community type to physicochemical parameters. In a survey which took place over the whole of the United Kingdom in the 1970's, Decorana revealed 11 key variables which produced 58% chance of correct first prediction of one of 10-25group-sites. These parameters were: 1) distance from the source (1-10), 2) discharge (1-10), 3) latitude, 4) longitude, 5) altitude, 6) slope, 7) width, 8) depth, 9) substrate (% 5 categories), 10) alkalinity 11) chloride.
From the above information the following predictions can be made about a site: 1) presence/absence of families, 2) presence/absence of species, 3) BMWP score (Biological Monitoring Working Party), 4) ASPT score (Average Score Per Taxon). If a site has a probability of less than 5%, one does not proceed. For site classification, three seasons data per year (3 samples per site) are requested, while for fauna prediction one season's data is adequate. From the original survey, the ASPT was predicted in the U.K. for a site directly using a suite of 5 variables in a multiple regression equation, which explains 68% of the total variation (there have been used 118 families and 578 taxa at the species level). The equation of ASPT prediction was the following: ASPT=7.331-0.00269A-0.876C-0.133Too-0.05395S-0.051D (where A: alkalinity, C: log10 chloride, Too: log10 total oxidized oxygen, S: mean substratum, D: log10 distance from the source).
Extension of Twinspan and Decorana Statistical analyses available so far have either assumed linear relationships (but relationships may be unimodal, like a bell shaped Gaussian curve) or were restricted to regression analyses of the response of each species seperately. CANOCO has been mainly developed to overcome the above problem: The CANOCO program is an extension of Decorana. It escapes the assumption of linearity and is able to detect unimodal relationships between species (Figure 2) or/and sites (Figure 3) and external variables. It is particularly good for a forward selection of environmental variables in order to determine which variables best explain the species data. It selects a linear combination of environmental variables, while it maximizes the dispersion of the scores of the species and allows us to see whether species are related to environmental variables (This uses the Monte Carlo permutation test). CANOCO can analyse 1,000 samples, 700 species, 75 environmental variables and 100 covariables (total data size < 80,000).
The other problem was the classification of communities at each site into an hierarchical way on the basis of their taxonomic composition. Species are classified simultaneously on the basis of their occurrence in site groups. FUZZY overcame this problem. FUZZY is an extension of Twinspan. Species are classified as well as samples. Both ordination and classification are done. In the results, there is no clearcut transition from one class to another and many intermediate situations may occur. It does not assume the existence of discrete benthic populations between the various streches of a river system, but identifies the continuum and gradual change in their faunal composition. The maximum Fuzzy membership values are usually low (0.5-0.7) and they rarely exceed the value of 0.9, which agrees with the fact that communities are formed along gradients, without sharp boundaries, except in cases of pulse or chronic disturbances (Figure 3). The number of clusters (groups) are decided according to a parameter which is an integer number between 2-30: the largest the partition coefficient the best except if the number is very high. If convergence fails then we start from the beginning with a different number of clusters.
Biodiversity in the Water programme The water-programme is centered around biodiversity. That is first of all because biodiversity is an adequate tool to characterise the environment. Biodiversity means in general all aspects of variety in the living world, but more specifically it can be expressed as: 1) the collection of species present in an area, 2) the amount of genetic variation or 3) the number of community types. In this context we are talking about biodiversity as the assembly of species. Both the collection of species that are present and those that are absent, will say something about the water itself and the water habitat. Comparisons of biodiversity between localities, and variation over time, will give information about the environmental status and indicate eventual qualitative changes. Other reasons for using the biodiversity in this porgramme are the educational aspects. Many species can be identified with small resources without expensive apparatus. To some extent it can be done by the students and their teachers. In addition are environmental problems normally complex problems.
REFERENCES Anagnostopoulou, M. (1993). The relationship between the macroinvertebrate community and water quality, and the applicability of biotic indices in the River Almopeos system (Greece).- M. Sc. thesis, Department of Environmental Biology Manchester, U. K. Anagnostopoulou M., Lazaridou-Dimitriadou M. & White K. N. (1994). The freshwater invertebrate community of the system of the river Almopeos, N. Greece. Proc. 6th Zoogeogr. Intern. Congr. (Thessaloniki, 1993), Bios, 2: 79-86. Armitage P.D., Moss D., Wright J.F, and Furse M.T. (1983). The performance of a new biological water quality score system based on macroinvertebrates over a wide range of unpolluted running water sites. Wat. Res. 17, 333-347. British Ecological Society (1990). River water quality, Ecological studies No. 1, Field Studies Council, 1-43. Calow, P. and Petts, G.E. (eds) (1992). The Rivers Handbook, Hydrological and ecological principles. Vol. 1. Blackwell Science. Calow, P.and Petts, G.E. (eds) (1994). The Rivers Handbook, Hydrological and ecological principles. Vol. 2. Blackwell Science. Copeland R.S., Lazaridou-Dimitriadou M., ArtemiadouV., Yfantis G., White K.N. and Mourelatos S. (1997). Ecological quality of the water in the catchment of river Aliakmonas (Macedonia, Hellas). Proceedings of the 5th Conference on Environment Science and Technology , Molyvos, 1-4 September, 27-36.
De Pauw N. & Vanhooren G. (1983). Method for biologicalquality assessment of water courses in Belgium. Hydrobiologia, 100, 153-168. European Union Commission. (1978). Directive on the quality of fresh water for the protection and improvement of fish life. Official Journal of the European Communities , No 222/1/ 14.8.78. European Union Commission. (1980). Directive on the quality of drinking water. Official Journal of the European Communities , No 80/778/15.07.80 European Union Commission (1997). Proposal for a Council Directive establishing a framework for Community action in the field of water policy . Official Journal of the European Communities , No C 184/20, 17.6.97. Extence C.A., Bates A.J., Forbes W.J. and Barham P.J. (1987). Biologically based water quality management. Environmental Pollution 45, 221-236. Farmer, A. (1997). Managing environmental pollution. Routledge Environmental Management Series. Ford J., Yfantis G., Artemiadou V., Lazaridou-Dimitriadou M., White K. N. (1998). Ecological evaluation of water quality in river Mavrolakkas (Olympiada, Halkidiki), from May to August 1997. Proceedings of the International Conference "Protection and Restoration of the Environment IV" , 1-4 July, Sani Halkidiki, 144-152. Goldman G.R. & Horne A.J. (1983). Limnology. McGraw - Hill Book Company. Harper, D.M. and Ferguson, A.J.D. (eds) (1995). The ecological basis for river management. John Wiley & Sons. Haslam, S.M. (1995). River Pollution: An Ecological Perspective. John Wiley & Sons. Hellawell J.M. (1986). Biological indicators of freshwater pollution and environmental management . Elsevier Applied Science Publishers, London. Hill M.O. (1979). DECORANA - A Fortran program for detrended correspondence alalysis and reciprocal averaging. Ecology and Systematics, Cornell University, Ithaca, New York. Hynes H.B.N. (1970). The Ecology of Running Waters. Liverpool University Press. Jeffries M. & Mills D. (1990). Freshwater Ecology, Principles and Applications. Belhaven Press, London and New York. Karr J.R. & Chu E.N. (1999). Restoring life in running waters. Better Biological Monitoring. Island Press. U.S.A. Krenkel P.A. & Novotny V. (1980). Water quality management. Academic Press Inc. Langrick J.M., Artemiadou V., Yfantis G., Lazaridou-Dimitriadou M., White K. N. (1998). An integrated water quality assessmentof the river Axios, Northern Greece. Proceedings of the International Conference "Protection and Restoration of the Environment IV" , 1-4 July, Sani Halkidiki, 135-143. Lazaridou-Dimitriadou M., Artemiadou V., Yfantis G., Mourelatos S. and Mylopoulos J. (1998). Contribution to the ecological quality of running waters in the river Aliakmon (Macedonia, Hellas). A multivariate approach. Submitted. Mason C.F. (1991). Biology of freshwater pollution. Longman Group U.K. Ltd. Metcalfe L.J. (1989). Biological water quality assessment of running waters based on macroinvertebrate communities : History and present status in Europe. Environmental Pollution 60, 101-139. Metcalfe L.J. & Smith M. (1994). Invertebrates ecology and survey methods, in The Rivers Handbook, Hydrological and ecological principles. Vol. 2, edited by Calow P. & Petts G.E., Blackwell Scientific Publications. Ter Braak C.J.F. (1988). CANOCO - a FORTRAN program for canonical community ordination (version 2.1).Tecnical report: LWA-88-02. Wright J.F., Hiley P.D., Cameron A.C., Wigham M.E. and Berrie A.D. (1983). A quantitative study of the macroinvertebrate fauna of five biotopes in the river Lambourn, Berkshire, England. Arch. Hydrobiol. 96, 271-292.