Download
1 / 76
760 likes | 930 Views
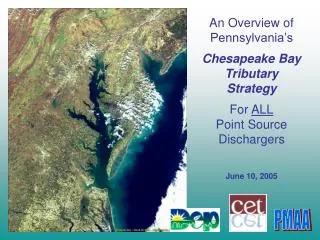
An Overview of Pennsylvania’s Chesapeake Bay Tributary Strategy For ALL Point Source Dischargers June 10, 2005. PMAA. Watershed-wide Pollution Reductions Needed. The pollutants causing water quality impairments drain into to the Bay and its rivers from the entire watershed.

E N D
An Overview of Pennsylvania’s Chesapeake Bay Tributary Strategy For ALL Point Source Dischargers June 10, 2005 PMAA
Watershed-wide Pollution Reductions Needed The pollutants causing water quality impairments drain into to the Bayand its rivers fromthe entire watershed. Chesapeake Bay Watershed Boundary
40 35 30 25 Commercial Harvest (millions of lbs) 20 15 VA 10 MD 5 0 53 55 57 59 61 63 65 67 69 71 73 75 77 79 81 83 85 87 89 91 93 95 97 99 00 Living Resource Protection & Restoration The new agreement commits to increase native oysters tenfold by 2010. Declines in Oyster Harvests are Beginning to Reverse… ... but much more needs to be done. Declines are due to overharvest, disease, pollution and loss of oyster reef habitat. Year
Chesapeake Bay Partners • Signatories to the Chesapeake Bay agreement • EPA (representing the Federal government) • Jurisdictions of MD, PA, VA and DC • Chesapeake Bay Commission (representing MD, PA and VA state legislatures) • Headwater states • DE, NY and WV • Memorandum of Understanding committing to water quality goals and commitments
Chesapeake 2000 • Protection and Restoration of: • Living Resources • Vital Habitat • Water Quality • Sound Land Use • Stewardship and Community Engagement
Restored Water Quality Means: • More oxygen and improved habitat for more fish, crabs and oysters. • Clearer water and more underwater Bay grasses. • Fewer algae blooms and better fish food.
Chesapeake Bay Water Quality Criteria • Water Clarity – light for underwater Bay grasses • Chlorophyll a – base of the Bay food chain • Dissolved Oxygen – for fish, crabs and oysters Together, these three criteria define the conditions necessary to protect the wide variety of the Bay’s living resources and their habitats.
WQ Criteria vs. Nutrient and Sediment • Reduction of Nutrients: • Reduce algae blooms • Improve water clarity • Increase dissolved oxygen • Increase zooplankton • Reduction of Sediment: • Improve water clarity • Improve habitat
The Model Regional Acid Deposition Model Watershed Model Chesapeake Bay Estuary Model Package
Susquehanna N 80.99 P 2.52 W. Shore MD. N 11.29 P 0.84 Cap Loads for the Major Basins (Based on April 2003 Agreement) Potomac N 35.78 P 3.48 East. Shore MD N 14.1 P 1.14 Patuxent N 2.46 P 0.21 Rappahannock N 5.24 P 0.62 York N 5.70 P 0.48 East. Shore VA N 1.16 P 0.08 James N 26.43 P 3.42 Note: Clear Skies Accounts for 8 M lbs. N
PA Reservoir System 3,100,000 tons sediment 75,000 tons nitrogen 4,350 tons phosphorus 2,210,000 tons sediment (70%) 1,500 tons nitrogen (2%) 1,740 tons phosphorus (40%) 890,000 tons sediment 73,500 tons nitrogen 2,610 tons phosphorus The reservoir system on the lower Susquehanna affects the amount of nutrients and sediment that reach the Bay. Upper two reservoirs have reached capacity. Conowingo Reservoir may reach capacity in about 25 years.
Phase 5 Calibration • Phase 4.3 – 26 calibration stations • Phase 5.0 – 236 hydrology and 100+ water quality calibration stations
Comparing 2002 and Cap LoadsBay-wide vs. Pennsylvania 34% Reduction Needed
Comparing 2002 versus Cap LoadsBay-wide vs. Pennsylvania 31% Reduction Needed
Pennsylvania’s Chesapeake Bay Tributary Strategy Prepared by the Pennsylvania Department of Environmental Protection December 2004 Edward G. Rendell, Governor Kathleen A. McGinty, Secretary Commonwealth of Pennsylvania Department of Environmental Protection An Equal Opportunity Employer 3900-BK-DEP1656 Rev. 1/2005 Last published in 2002
Sources of Total Nitrogen Bay-wide vs. Pennsylvania Based on Pounds per Year
Sources of Total Phosphorus Bay-wide vs. Pennsylvania Based on Pounds per Year
Non-Point Sources Agriculture Forest Urban Septic Systems Meet Bay water quality goals through Best Management Practices (BMPs) Point Sources “Significant” Point Sources (municipal and industrial) Smaller Point Sources New dischargers NPDES Annual Load Limits for: Total Nitrogen (Total Nitrogen = Organic nitrogen, ammonia, nitrate and nitrite) Total Phosphorus Pennsylvania’sChesapeake Bay Tributary Strategy
Currently Tracked BMPs Nutrient Management Animal Waste Management Soil Conservation Plans Conservation Tillage Retire Highly Erodible Land Forest & Grass Buffers Wetland Restoration Rotational Grazing Stream Bank Fencing Phytase for Poultry Promoting/Tracking Additional BMPs Cover Crops Precision Agriculture Precision Dairy Feeding Advanced No-Till Horse Pasture Management Manure Transport Yield Reserve Carbon Sequestration Precision Rotational Grazing Phytase for Swine Ag Ammonia Emission Controls Non-Point - Agriculture
Non-Point Urban Currently Tracked BMPs • Erosion & Sedimentation Control • Dirt & Gravel Road • Stormwater Management Promoting/Tracking Additional BMPs • Urban Street Sweeping • Stream Restoration • Low Impact Development • Stormwater Retrofits • Nitrogen Removing Septic Systems • Urban Nutrient Management
13 Non-Point Watershed Strategies • 13 Watersheds identified in PA: 12 in Susquehanna; 1 in Potomac • The strategy, by watershed: • identifies specific land uses • watershed nutrient and sediment allocations • appropriate BMPs.
POINT SOURCES PENNSYLVANIA’S CHESAPEAKE BAY TRIBUTARY STRATEGY
MAJOR POINT SOURCES IN PA • 140+ Sewage treatment plants in the Bay Watershed above 0.4MGD • 20 Significant Industrial Dischargers • Constitute a very significant portion of the nutrient loads to the Bay • We’re talking about total N and total P • 3 DEP Regions involved
THE POINT SOURCE CHALLENGE • Point sources constitute 11% of the TN load and 18% of the TP load • Goal is to remove about 4 million lbs TN and about 400,000 lbs TP • Cap loads after goal is reached
WHATS BEHIND THE NUMBERS • Need to equitably allocate allowable loads among point source and non-point sources • Everybody do their “fair share” of the burden • Typical way to do baseline allocations for point source discharges is to choose a cost-effective, achievable level of technology
SIGNIFICANT STP SOURCES • STPs with design flow 0.4 MGD or above • Must meet loading based upon performance levels of 8 mg/l N and 1mg/l P –presuming BNR and chemical precipitation of P • These loads are to be based on projected 2010 flows – projecting from 2000 flows, census, Ch 94 • These loads are then the “caps” • Remember these are loadings in pounds not concentrations • Running annual average, reported monthly
SMALLER STP SOURCES • STPs with design flow under 0.4 mgd • Must meet loads based upon existing performance levels of total P and total N • Load is based upon design flow, not 2010 flow • These loads are then the “caps” • STPs under a certain size ( say 2000 gpd ) exempt
Rules for both significant and small STPs • Design flows and 2010 flows are the “base sewage flows” or “dry weather flows”. • Prevents getting artificially high allowable loads for leaky sewer systems • If there are local conditions requiring more stringent total N or total P limits, these trump the Bay limits
INDUSTRIAL DISCHARGERS • 20 Significant • Set at current loading. • Some additional reserve for growth • May set a combined cap for all industry, and treat all industry as a consortium.
New or expanded discharges • Zero net total N and total P loads. • If replacing existing discharges or existing on-lot disposal systems, credit for eliminating that load counts towards the net • If discharge is totally new (development induced), new discharger must: • Treat and land apply wastewater • Treat and recycle • Treat and discharge and buy credits
“Credits” ?? • DEP will be developing a nutrient trading program • Instead of treating down to assigned cap load, pay someone else to remove your excess load • Trading will probably be point-to-point, or point-to- non-point. • Trading will probably be facilitated by a “watershed permit”
What is a “watershed permit” • An “overlay” permit for a number of discharges all on one large watershed, to accomplish a load allocation • Would “overlay” the normal NPDES permits • Would be an “accounting” permit for all the established total N and total P load limits for all dischargers on the watershed. • Would be the accounting system for nutrient trading • Needs a basis in regulation
How might this all roll out • Monitoring may be required soon – expect a letter in the mail • A defining date is the MD adoption of Bay WQ standards – possibly this summer • Official permit actions (normal renewals or new) after this date may need to contain load limits • Flexible period of time to comply • Next defining date will be DEP passage of regs and creation of a watershed permit – early 2007 • Actions after that date would require load limits.
SOME OTHER CONSIDERATIONS • We are working with PMAA and consultants make a smooth transition • Some issues still need to be fleshed out • Important to keep lines of communication open • Planning is important • Funding is important --- we understand that, and will do all we can
Point Sources – Cap Load Calculations • “Significant” Municipal Point Sources: (DEP Calc. 2010 flow) x 8 mg/L TN x 8.34 x 365 days (DEP Calc. 2010 flow) x 1 mg/L TP x 8.34 x 365 days • “Significant” Industrial Point Sources: ‘Current Loadings + margin for growth’ • Remaining Point Source Dischargers: WWTP Design Flow x ~20 mg/L TN x 8.34 x 365 days WWTP Design Flow x ~6 mg/L TP x 8.34 x 365 days • New Point Source Dischargers: TN and TP cap loads = 0 lbs NOTE: Local stream conditions may dictate a lower cap load (Total Maximum Daily Loads))
“Significant” Municipal Point Sources DEP Calc. 2010 flow • Details not currently available from DEP • Previous discussions included: • 2000 Annual Average Flow as the base flow. • 2000 was a typical precipitation year. • Increase the base flow by a population increase from 2000 – 2010.
“Significant” Municipal Point Sources Example Nitrogen Calculation DEP Calc. 2010 flow: 1 MGD 1 MGD x 8 mg/L TN x 8.34 x 365 days = 24,382 lb/yr Cap Load = 24,382 lb/yr (~67 lb/d, average) Average TN from using 2010 Flow: 8 mg/L
“Significant” Municipal Point Sources Example Nitrogen Calculation DEP Calc. 2010 flow: 1 MGD 1 MGD x 8 mg/L TN x 8.34 x 365 days = 24,382 lb/yr Cap Load = 24,382 lb/yr (~67 lb/d, average) Average TN from using 2010 Flow: 8 mg/L “Any increase in the discharge volume will necessarily result in a commensurate reduction in the nutrient concentration in order to stay below the annual load allocation.” – page 47
“Significant” Municipal Point Sources Example Nitrogen Calculation DEP Calc. 2010 flow: 1 MGD WWTP Design Flow: 2 MGD Cap Load = 24,382 lb/yr (~67 lb/d, average) Average TN from using 2010 Flow: 8 mg/L Average TN at Design: 4 mg/L
“Significant” Municipal Point Sources Example Nitrogen Calculation DEP Calc. 2010 flow: 1 MGD WWTP Design Flow: 2 MGD Future Upgrade to WWTP: 3 MGD Cap Load = 24,382 lb/yr (~67 lb/d, average) Average TN from using 2010 Flow: 8 mg/L Average TN at Design: 4 mg/L Average TN with at Upgrade Design: 2.6 mg/L