Download
1 / 15
150 likes | 283 Views
Stellar Parameters through Analysis of the Kepler Oscillation Data. Chen Jiang & Biwei Jiang Department of Astronomy Beijing Normal University 2 April 2010. Kepler Mission : A search for habitable planets.

E N D
Stellar Parameters through Analysis of the Kepler Oscillation Data Chen Jiang & Biwei Jiang Department of Astronomy Beijing Normal University 2 April 2010
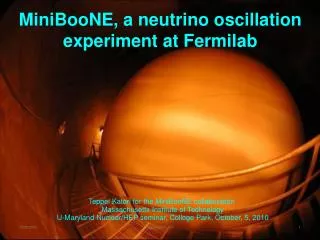
Kepler Mission : A search for habitable planets SUCCESSFULLY LAUNCHED:On 7 March 2009 at 03:50 Universal Time (6 March at 10:50 p.m. local time at Kennedy Space Center) The Extended Solar Neighborhood
Kepler mission will not only be able to search for planets around other stars, but also yield new insights into the parent stars themselves. How old are stars? How do they evolve? Is the Sun a typical star? How does matter behave under the extreme conditions in stars?
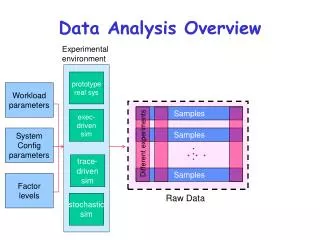
Stellar Parameters Determination • Objects: red giants • Data : red giant oscillation data from Kepler project • Code: Yale Stellar Evolution Code (YREC7) • Parameters to determine: mass and Z • Comparison: L, Teff, and Δν
Solar-like Oscillation in Red Giants • Solar-like oscillations are caused by turbulent convective motions. They are stochastically excited and have very small amplitudes. • Solar-like oscillations are predicted for low-mass main sequence stars and stars located the red edge of the classical instability strip with mass about 1.6Msun, as well as in red giants.
Data Analysis • Purpose: to identify the frequency of maximum power (νmax ) and the large separation of the oscillations (Δν) from the power spectrum; • Method: Fourier transform to obtain νmax , Δν; • Data: 50 low-luminosity stars (νmax > 100 μHz, L 30L ), long-cadence(29.4-min sampling), A total of 1639 integrations ( 14 bad ones), 34 days (T. R. Bedding, D. Huber, et al. 2010)
Light curve and power spectrum of a star in the Kepler Data νmax = 100.988 μHz Δν = 9.8205 μHz
Known: R/R , Teff , log(G) , [Fe/H] (Z/X) = 0.0245 ( Grevesse & Noels, 1993) (Z/X)=0.031 • To know: Z , mixing length , age , mass
Estimate the mass: Kjeldsen & Bedding (1995) ,Toutain &Fröhlich (1992) Preliminary estimation:
Grid of evolutionary tracks: • For the sets of the modelling parameters that agree with the observational constraints,we used a fine resolution,
Way to Go… • Use a criterion to choose the best fitted models, χ2 minimization maybe. • Add δν to constrain the age of the model. • Consider the α to be a input parameter.