Management and Environmental Factors Influencing Crop Yield and Quality
Explore the interplay of environmental conditions, management practices, and physiological processes on crop yield and quality, using key factors like nutrient availability, sowing date, and solar radiation. Learn about growth, development, and biomass accumulation in different cultivars. Discover the impact of light, temperature, and irrigation on crop productivity.

Management and Environmental Factors Influencing Crop Yield and Quality
E N D
Presentation Transcript
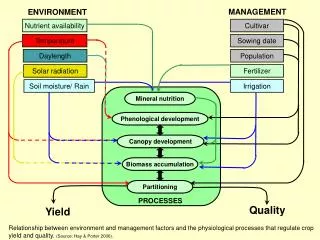
MANAGEMENT ENVIRONMENT Nutrient availability Cultivar Temperature Sowing date Daylength Population Solar radiation Fertilizer Soil moisture/ Rain Irrigation Mineral nutrition Phenological development Canopy development Biomass accumulation Partitioning PROCESSES Quality Yield Relationship between environment and management factors and the physiological processes that regulate crop yield and quality. (Source: Hay & Porter 2006).
Light • Complex & dynamic signal • Quantity of light • photons falling /area/time • Quality of light • plant responses
Growth vs Development • Growth:an irreversible increase in DM - function of light interception and - photosynthesis and then - assimilate partitioning • Development: irreversible change in the state of an organism - fixed pattern and reversion is rare Eg. silking, pod initiation, dough development
Plant development A) Vegetative • Emergence and • Leaf appearance rates (phyllochron). B) Reproductive • Time of flowering (anthesis), • Duration of grain fill. Driven by temperature modified by photoperiod and vernalization
Sowing to emergence Thermal time - soil temperature
Time for germination 25 Ryegrass 20 15 Days to 75% germination 10 5 0 0 10 20 30 40 Temperature (°C)
Germination rate Topt Tt = 65°Cd Tmax Tb 0.4 0.3 0.2 Germination rate (1/days) 0.1 0.0 0 10 20 30 40 Temperature (°C)
Thermal time • Tt = Thermal time (°Cd) = Tmax + Tmin - Tb 2 • Growing degree days (GDD) • Heat units (HU)
0.5 Temp. Interval 5.9 18.5 0.054 8.7 7.5 0.133 12.0 3.6 0.280 15.1 2.3 0.435 0.4 0.3 Development rate (nodes/d) Whero 27oCd/node 0.2 Massey 37oCd/node Tb= 0.1 0 0 2 4 8 6 16 10 12 14 18 20 Temperature (oC)
Crop Growth and Yield 1) C = E*Q C = daily rate of DM prod. E = radiation use efficiency Q = PAR intercepted 2) Y = HI*C*dt Y = seed yield/unit area HI = harvest index
Change in HI over time Year Yield Height HI BY (t/ha) (m) (%) (t/ha) Little Joss 1908 5.22 1.42 36 14.5 LJ (low fert.) 3.30 1.12 34 9.7 Cap- Dep. 1953 5.86 1.10 42 rht2 Hobbit 1977 7.30 0.80 48 Norman 1981 7.57 0.84 51 14.8 Nor. (low fert.) 4.59 0.64 49 9.4
Light - photosynthesis to produce CHO’s for growth. - Photosynthetically active radiation (PAR) is in the visible range (400-700nm). - Conversion of PAR to DM ~2.5 g DM /MJ/m2 for C3 plants ~3.8 g DM /MJ/m2 for C4 plants
Irrigated Dryland Total DM production (C) from successive harvests and intercepted PAR (Q) for field peas in 5 experiments in 4 seasons with different cultivars, sowing times and irrigation treatments. The form of the regression is: 2.36±0.03 g DM/MJ PAR (R2=0.97). Source: Wilson 1987
20 20 Sugar beet Potatoes Total DM (t/ha) Total DM (t/ha) 10 10 Barley Apples 0 0 0.0 0.0 0.5 0.5 1.0 1.0 1.5 1.5 2.0 2.0 2 2 Intercepted solar radiation (GJ/m Intercepted solar radiation (GJ/m ) ) (Source: Monteith, 1977)
1200 December (14.4 MJ PAR/m2/d) 1000 March (6.5 MJ PAR/m2/d) June (2.2 MJ PAR/m2/d) 800 Irradiance (W/m2) 600 400 200 0 0 2 4 6 8 10 12 14 16 18 20 22 24 Time of day (h) Global irradiance on sunny days (W/m2)
Photosynthetically active radiation (PAR) PAR averages 11.4 MJ/m2/d in summer (Dec) 2.2 MJ/m2/d in winter (Jun) and therefore potential dry matter yield is: summer: 11.4 x 2.5 = 28.5 g/m2 = 285 kg DM/ha/d winter: 2.2 x 2.5 = 5.5 g/m2 = 55 kg DM/ha/d Conclusion: Available PAR levels are non-limiting for pasture production in New Zealand
Pasture production in Canterbury Potential Actual
Critical GAI Potato 90 90 70 70 50 50 Proportion of incident PAR intercepted (%) Proportion of incident PAR intercepted (%) 30 30 10 10 0 1 2 3 0 1 2 3 4 5 6 4 5 6 Green Area Index (Source: Khurana & McLaren 1982)
Leaf area index (LAI) = area of leaf lamina (m2) area of soil surface (m2 ) influenced by; i) Species LAI Cmax (kg/ha/d) white clover 3.0 121 ryegrass 7.1 156 mixture 4.5 140 maize 7.4 261
Measurements Soilmoisture Lightenvironment Chemical Analysis: • N (shoots and roots) • Starch in roots • Soluble sugars in roots Photosynthesis Others: • SLW • SPAD • Chla+b
Non Limited Nitrogen 3.5% Temperature 14oC Predawn LWP -10 bar 30 25 20 15 Photosynthetic rate mmol CO2/m2/s 10 5 0 -5 0 500 1000 1500 2000 2500 Light level (PPFD mmol m2/s) (Source: Peri et al. 2002)
19-23oC 1.2 Pmaxs = 0.99xe(-0.5x(T-20.4/7.90)2) 1.0 0.8 0.6 Pmaxs(dimensionless) 0.4 0.2 0.0 0 5 10 15 20 25 30 35 o Temperature ( C) (Source: Peri et al. 2002)
1.2 1.0 Pmax = 1.0716 - 0.0765x s 0.8 0.6 Pmaxs(dimensionless) 0.4 0.2 0.0 0 -2 -4 -6 -8 -10 -12 -14 -16 -18 Predawn leaf water potential (bars) (Source: Peri et al. 2002)
2.6% N 5.2% N 1.0 0.8 0.6 Pmaxs(dimensionless) 0.4 0.2 0.0 0 10 20 30 40 50 60 Foliage N concentration (g N/kg DM) (Source: Peri et al. 2002)
Modelling photosynthesis f (T) f (N) f (lp) Ppmax * * * Where Ppmax is maximum measured photosynthetic rate of 27.4 mmol CO2 m-2 s-1 Most basic approach (Source: Peri et al. 2002)
200 kg N/ha 100 kg N/ha Control (0 N) anthesis 6 Green leaf area index 3 0 300 150 0 Days after crop emergence (Source: Green 1987)
Effect of water stress on relative yield DL 78 mm I+N D+N 100 y = -1.45%/mm Relative yield 50 0 0 50 100 150 Soil moisture deficit (mm) (Source: Mills et al. 2006)
Patterns of water extraction Water extraction (mm water/10 cm soil) 0 8 16 24 32 0.0 Ryegrass Clover 0.5 1.0 50 mm Depth (m) 250 mm 1.5 Lismore Wakanui 2.0 Stoney loam Silt loam (100 mm) (380 mm) 2.5
D-N 21.9 t/ha I +N D+N I -N 15.7 t/ha 9.8 t/ha 6.3 t/ha Growth rates (2 year means) 120 90 Growth rate (kg/ha/d) 60 30 0 J A S O N D J F M A M J J Month
Water stress effect on yield D+N 15.7 t/ha 30 Jan 21 Nov 30 I+N 21.9 t/ha y = 7.0 kg DM/ha/oCd 20 DM yield (t/ha) 10 0 0 1000 2000 3000 Thermal time (Source: Mills et al. 2006)
I–N y = 3.3 kg DM/ha/oCd DM yield response to thermal time (Tb = 3°C) 30 I+N 21.9 t/ha y = 7.0 kg DM/ha/oCd 20 DM yield (t/ha) 9.8 t/ha 10 0 0 1000 2000 3000 Thermal time (°Cd) (Source: Mills et al. 2006)
Lucerne 28 kg DM/ha/mm Ryegrass / clover Ryegrass only 20 kg DM/ha/mm Spring WUE: legume = (nitrogen) 6 4 Accumulated DM (t DM/ha) 13 kg DM/ha/mm 2 0 0 100 200 300 Water use (mm) (Source: Moot et al. 2008)
60 y = 28.0±0.66x (R2=0.96) 50 40 30 Fixed N (kg N/ha) 20 10 White clover Sub clover 0 0 500 1000 1500 2000 Clover yield (kg DM/ha) Biological N fixation (Source: Lucas et al. 2010)
Conclusions • Light interception drives growth • Nitrogen affects leaf area expansion • Temperature affects leaf area expansion • Water affects leaf area expansion • NTW affect photosynthesis • Pests and diseases affect leaf area! • CANOPY MANAGEMENT