Download
1 / 28
280 likes | 443 Views
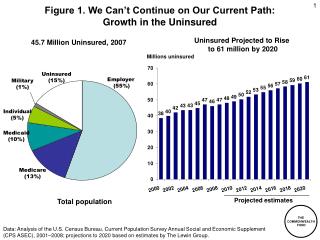
Figure 1. We Can’t Continue on Our Current Path: Growth in the Uninsured. Uninsured Projected to Rise to 61 million by 2020. 45.7 Million Uninsured, 2007. Millions uninsured. Uninsured (15%). Employer (55%). Military (1%). Individual (5%). Medicaid (10%). Medicare (13%).

E N D
Figure 1. We Can’t Continue on Our Current Path: Growth in the Uninsured Uninsured Projected to Rise to 61 million by 2020 45.7 Million Uninsured, 2007 Millions uninsured Uninsured (15%) Employer (55%) Military (1%) Individual (5%) Medicaid (10%) Medicare (13%) Projected estimates Total population Data: Analysis of the U.S. Census Bureau, Current Population Survey Annual Social and Economic Supplement (CPS ASEC), 2001–2008; projections to 2020 based on estimates by The Lewin Group.
Figure 2. 75 Million People Were Uninsured for All or Part of the Year Before the Start of the Recession Uninsured All Year 38m 13% Uninsured All Year 37m 14% Uninsured Part Year 37m 12% Uninsured Part Year 34m 13% Insured All Year 224m 75% Insured All Year 189m 73% Total Population = 299 million Under-65 Population = 260 million Source: Analysis of the 2006 of the Medical Expenditure Panel Survey by B. Mahato of Columbia University for The Commonwealth Fund.
Figure 3. Uninsured Rates High Among Adultswith Low and Moderate Incomes, 2001–2007 Percent of adults ages 19–64 50 49 41 28 28 24 18 13 8 4 2001 2001 2007 2001 2007 2001 2007 2001 2007 2007 Low income Moderate income Middle income High income Total Note: Income refers to annual income. In 2001 and 2003, low income is <$20,000, moderate income is $20,000–$34,999, middle income is $35,000–$59,999, and high income is $60,000 or more. In 2005 and 2007, low income is <$20,000, moderate income is $20,000–$39,999, middle income is $40,000–$59,999, and high income is $60,000 or more. Subgroups may not sum to totals because of rounding. Source: S. R. Collins, J. L. Kriss, M. M. Doty, and S. D. Rustgi, Losing Ground: How the Loss of Adequate Health Insurance Is Burdening Working Families: Findings from the Commonwealth Fund Biennial Health Insurance Surveys, 2001–2007 (New York: The Commonwealth Fund, August 2008).
Figure 4. The Majority of U.S. Workers Get Their Health Insurance Through Employers, 2007 Uninsured (14%) Other coverage* (9%) Public programs (5%) Own employer coverage (56%) Other employer coverage (16%) 122.2 Million Full- and Part-Time Workers Ages 19–64 *Includes those with individual insurance and “other” responses. Source: M. M. Doty, S.R. Collins, S.D. Rustgi, and J.L. Nicholson, Out of Options: Why So Many Workers in Small Businesses Lack Affordable Health Insurance and How Health Care Reform Can Help: Findings from the Commonwealth Fund Biennial Health Insurance Survey, 2007, The Commonwealth Fund, September 9, 2009. Data: The Commonwealth Fund Biennial Health Insurance Survey (2007).
Figure 5. 2009 Changes in Coverage at Different Levels of Unemployment (Base of 4.6% in 2007) Millions of People Source: J. Holahan and A.B. Garrett, Rising Unemployment, Medicaid, and the Uninsured, Publication No. 7850 (Washington: Kaiser Commission on Medicaid and the Uninsured, January 2009).
Figure 6. Employer Coverage Continues to Be Major Source of Coverage for Employees of Larger Firms But Has Declined Among Small Firms Percent of firms offering health benefits Source: The Kaiser Family Foundation/Health Research and Educational Trust, Employer Health Benefits, 2000 and 2008 Annual Surveys.
Figure 7. Employer-Sponsored Insurance Coverage Declined Among Small Firm Employees, 2003–2007 Percent of working adults ages 19–64* 85 84 57 49 Small Firms (fewer than 50 employees) Large Firms (50 or more employees) *Includes both part-time and full-time workers. Note: Subgroups may not sum to totals due to rounding. Source: M. M. Doty, S.R. Collins, S.D. Rustgi, and J.L. Nicholson, Out of Options: Why So Many Workers in Small Businesses Lack Affordable Health Insurance and How Health Care Reform Can Help: Findings from the Commonwealth Fund Biennial Health Insurance Survey, 2007, The Commonwealth Fund, September 9, 2009. Data: The Commonwealth Fund Biennial Health Insurance Survey (2003 and 2007).
Figure 8. Low-Wage Employees in Small Firms Are Less Likely to Have Employer-Sponsored Insurance Coverage Percent of working adults ages 19–64* 94 85 68 62 49 38 Small Firms (fewer than 50 employees) Large Firms (50 or more employees) *Includes both part-time and full-time workers. Note: Subgroups may not sum to totals due to rounding. Source: M. M. Doty, S.R. Collins, S.D. Rustgi, and J.L. Nicholson, Out of Options: Why So Many Workers in Small Businesses Lack Affordable Health Insurance and How Health Care Reform Can Help: Findings from the Commonwealth Fund Biennial Health Insurance Survey, 2007, The Commonwealth Fund, September 9, 2009. Data: The Commonwealth Fund Biennial Health Insurance Survey (2007).
1999–2000 2006–2007 NH ME WA NH VT ME WA VT ND MT ND MT MN MN OR NY MA WI OR MA NY ID SD WI RI MI ID SD RI WY MI CT PA WY NJ CT IA PA NJ NE IA OH DE IN NE OH NV DE IN IL MD NV WV UT VA IL MD CO DC WV UT VA KS MO KY CA CO DC KS MO KY CA NC NC TN TN OK SC AR OK AZ NM SC AR AZ NM MS GA AL MS GA AL TX LA TX LA FL FL AK AK 23% or more HI HI 19%–22.9% 14%–18.9% Less than 14% Figure 9. Percent of Adults Ages 18–64 Uninsured by State Data: Two-year averages from the U.S. Census Bureau, CPS ASEC, 2000–2001 and 2007–2008; 1999–2000 estimates updated with 2007 CPS correction.
Figure 10. 25 Million Adults Underinsured in 200760 Percent Increase Since 2003 Uninsured during the year 49.5 (28%) Uninsured during the year 45.5 (26%) Insured all year, not underinsured 110.9 (65%) Insured all year, not underinsured 102.3 (58%) Insuredall year, underinsured* 25.2 (14%) Insuredall year, underinsured* 15.6 (9%) 2003 Adults ages 19–64 (172.0 million) 2007 Adults ages 19–64 (177.0 million) *Underinsured defined as insured all year but experienced one of the following: medical expenses equaled 10% or more of income; medical expenses equaled 5% or more of income if low-income (<200% of poverty); or deductibles equaled 5% or more of income. Data: The Commonwealth Fund Biennial Health Insurance Surveys (2003 and 2007). Source: C. Schoen, S. R. Collins, J. L. Kriss, and M. M. Doty, “How Many Are Underinsured? Trends Among U.S. Adults, 2003 and 2007,” Health Affairs Web Exclusive, June 10, 2008.
Figure 11. Two of Five Adults Uninsured or Underinsured; Percent Underinsured Triples for Middle-Income Percent of adults (ages 19–64) who are uninsured or underinsured 72 68 42 35 27 17 Under 200% of poverty Total 200% of poverty or more *Underinsured defined as insured all year but experienced one of the following: medical expenses equaled 10% or more of income, or 5% or more of income if low-income (<200% of poverty); or deductibles equaled 5% or more of income. Data: The Commonwealth Fund Biennial Health Insurance Surveys (2003 and 2007). Source: Commonwealth Fund National Scorecard on U.S. Health System Performance, 2008.
Figure 12. Over Half of Working Adults in Small Firms Were Uninsured or Underinsured During the Year, 2007 Adequately insured 48% Uninsured anytime 15% Uninsured anytime 36% Underinsured 13% Adequately insured 73% Underinsured 16% Firms with fewer than 50 employees 39.0 million Firms with 50 or more employees 76.9 million ^Includes both part-time and full-time workers. Underinsured is defined as having continuous health insurance coverage and spending 10 percent or more of income on out-of-pocket health care costs (or 5 percent or more if low income), or having deductibles of 5 percent or more of income. Source: M. M. Doty, S.R. Collins, S.D. Rustgi, and J.L. Nicholson, Out of Options: Why So Many Workers in Small Businesses Lack Affordable Health Insurance and How Health Care Reform Can Help: Findings from the Commonwealth Fund Biennial Health Insurance Survey, 2007, The Commonwealth Fund, September 9, 2009. Data: The Commonwealth Fund Biennial Health Insurance Survey (2007).
Figure 13. Deductibles Rise Sharply, Especially in Small Firms, 2000–2008 Mean deductible for single coverage (PPO, in-network) PPO = preferred provider organization. PPOs covered 57 percent of workers enrolled in an employer-sponsored health insurance plan in 2007. Source: The Kaiser Family Foundation/Health Research and Educational Trust, Employer Health Benefits, 2000 and 2008 Annual Surveys.
Figure 14. Insurance Benefits Are Not As Generous for Workers in Small Businesses Percent of working adults ages 19–64 with own employer-sponsored insurance* Coverage limits total amount it will pay for medical care No prescription drug coverage Fair or poor rating of insurance plan *Includes both part-time and full-time workers. Source: M. M. Doty, S.R. Collins, S.D. Rustgi, and J.L. Nicholson, Out of Options: Why So Many Workers in Small Businesses Lack Affordable Health Insurance and How Health Care Reform Can Help: Findings from the Commonwealth Fund Biennial Health Insurance Survey, 2007, The Commonwealth Fund, September 9, 2009. Data: The Commonwealth Fund Biennial Health Insurance Survey (2007).
Figure 15. Underinsured and Uninsured Adults at High Risk of Going Without Needed Care and Financial Stress Percent of adults (ages 19–64) *Did not fill prescription; skipped recommended medical test, treatment, or follow-up, had a medical problem but did not visit doctor; or did not get needed specialist care because of costs. **Had problems paying medical bills; changed way of life to pay medical bills; or contacted by a collection agency for inability to pay medical bills. Source: C. Schoen, S. Collins, J. Kriss, M. Doty, How Many are Underinsured? Trends Among U.S. Adults, 2003 and 2007, Health Affairs Web Exclusive, June 10, 2008. Data: 2007 Commonwealth Fund Biennial Health Insurance Survey.
Figure 16. Uninsured and Underinsured Adults with Chronic Conditions Are More Likely to Visit the ER for Their Conditions Percent of adults ages 19–64 withat least one chronic condition* *Hypertension, high blood pressure; heart disease; diabetes; asthma, emphysema, or lung disease. **Adults with at least one chronic condition who take prescription medications on a regular basis. Data: The Commonwealth Fund Biennial Health Insurance Survey (2007). Source: S. R. Collins, J. L. Kriss, M. M. Doty and S. D. Rustgi, Losing Ground: How the Loss of Adequate Health Insurance Is Burdening Working Families, The Commonwealth Fund, August 2008.
Figure 17. Lack of Insurance Undermines Preventive and Chronic Care Chronic Disease Under Control: Diabetes and Hypertension, 1999–2004 Receipt of Recommended Screening and Preventive Care*, 2005 Percent of adults *Recommended care includes: blood pressure, cholesterol, Pap, mammogram, fecal occult blood test or sigmoidoscopy/colonoscopy, and flu shot within a specific time frame given age and sex. **Refers to diabetic adults whose HbA1c is <9.0 ***Refers to hypertensive adults whose blood pressure is <140/90 mmHg. Data: Preventive care–B. Mahato, Columbia University analysis of Medical Expenditure Panel Survey; Chronic disease–J. M. McWilliams, Harvard Medical School analysis of National Health and Nutrition Examination Survey. Source: Commonwealth Fund National Scorecard on U.S. Health System Performance, 2008.
Figure 18. Uninsured Adults and Adults with Gaps in Coverage Have Lower Rates of Cancer Screening Tests, 2007 Percent of adults ages 19–64 Note: Pap test in past year for females ages 19–29, past three years age 30+; colon cancer screening in past five years for adults ages 50–64; and mammogram in past two years for females ages 50–64. Source: S. R. Collins, J. L. Kriss, M. M. Doty, and S. D. Rustgi, Losing Ground: How the Loss of Adequate Health Insurance Is Burdening Working Families: Findings from the Commonwealth Fund Biennial Health Insurance Surveys, 2001–2007, The Commonwealth Fund, August 2008.
Figure 19. Cost-Related Problems Getting Needed CareHave Increased Across All Income Groups, 2001–2007 Percent of adults ages 19–64 who had any of four access problems*in past year because of cost *Did not fill a prescription; did not see a specialist when needed; skipped recommended medical test, treatment, or follow-up; had a medical problem but did not visit doctor or clinic. Note: In 2001, low income is <$20,000, moderate income is $20,000–$34,999, middle income is $35,000–$59,999, and high income is $60,000+. In 2007, low income is <$20,000, moderate income is $20,000–$39,999, middle income is $40,000–$59,999, and high income is $60,000+. Data: The Commonwealth Fund Biennial Health Insurance Surveys (2001, 2007). Source: S. R. Collins, J. L. Kriss, M. M. Doty and S. D. Rustgi, Losing Ground: How the Loss of Adequate Health Insurance Is Burdening Working Families, The Commonwealth Fund, August 2008.
Figure 20. Problems with Medical Bills orAccrued Medical Debt Increased, 2005–2007 Percent of adults ages 19–64 with medical bill problems or accrued medical debt Note: Low income is <$20,000, moderate income is $20,000–$39,999, middle income is $40,000–$59,999, and high income is $60,000+. Data: The Commonwealth Fund Biennial Health Insurance Surveys (2005 and 2007). Source: S. R. Collins, J. L. Kriss, M. M. Doty and S. D. Rustgi, Losing Ground: How the Loss of Adequate Health Insurance Is Burdening Working Families, The Commonwealth Fund, August 2008.
Figure 21. Medical Bill Problems and Accrued Medical Debt, 2005–2007 Percent of adults ages 19–64 Source: S. R. Collins, J. L. Kriss, M. M. Doty and S. D. Rustgi, Losing Ground: How the Loss of Adequate Health Insurance Is Burdening Working Families, The Commonwealth Fund, August 2008.
Figure 22. More Than One-Quarter of Adults Under Age 65 With Medical Bill Burdens and Debt Were Unable to Pay for Basic Necessities Percent of adults ages 19–64 with medical bill problemsor accrued medical debt Source: M. M. Doty, S. R. Collins, S. D. Rustgi, and J. L. Kriss, Seeing Red: The Growing Burden of Medical Bills and Debt Faced by U.S. Families, The Commonwealth Fund, August 2008.
Figure 23. An Estimated 116 Million Adults Were Uninsured, Underinsured, Reported a Medical Bill Problem, and/or Did Not Access Needed Health Care Because of Cost, 2007 Medical bill/ debt problem 17.7 million 10% Adequate coverage and no bill or access problem 61.4 million 35% Medical bill/debt and cost-related access problem 54.4 million 31% Uninsured anytime during the year or underinsured 17.6 million 10% Cost-related access problem 25.9 million 15% 177 million adults, ages 19–64 Source: S. R. Collins, J. L. Kriss, M. M. Doty, and S. D. Rustgi, Losing Ground: How the Loss of Adequate Health Insurance Is Burdening Working Families: Findings from the Commonwealth Fund Biennial Health Insurance Surveys, 2001–2007, The Commonwealth Fund, August 2008. The Commonwealth Fund Biennial Health Insurance Survey (2007).
1999–2000 2005–2006 NH ME WA NH VT ME WA VT ND MT ND MT MN MN OR NY MA WI OR MA NY ID SD WI RI MI ID SD RI WY MI CT PA WY NJ CT IA PA NJ NE IA OH DE IN NE OH NV DE IN IL MD NV WV UT VA IL MD CO DC WV UT VA KS MO KY CA CO DC KS MO KY CA NC NC TN TN OK SC AR OK AZ NM SC AR AZ NM MS GA AL MS GA AL TX LA TX LA FL FL AK AK 16% or more HI HI 10%–15.9% 7%–9.9% Less than 7% 24 Source: Commonwealth Fund National Scorecard on U.S. Health System Performance, 2008 Figure 24. CHIP Has Reduced Rates of Uninsured Children in Most StatesPercent of Children Ages 0–17 Uninsured by State Data: Two-year averages 1999–2000, updated with 2007 Current Population Survey correction, and 2005–2006 from the Census Bureau’s March 2000, 2001 and 2006, 2007 CPS.
Figure 25. Low-Income Workers Are Eligible for COBRA at Only Half the Rate of Higher-Income Workers Ineligible, small- firm worker 6% Ineligible, small- firm worker 3% Ineligible, uninsured 7% Ineligible, insured but not through employer 11% Ineligible, uninsured 33% COBRA-eligible 38% COBRA-eligible 76% Ineligible, insured but not through employer 27% Below 200% FPL 200%+ FPL Source: M. Broaddus et al., Measures in House Recovery Package—But Not Senate Package—Would Help Unemployed Parents Receive Health Coverage (Washington, D.C.: Center on Budget and Policy Priorities, February 2009); M. M. Doty et al., Maintaining Health Insurance During a Recession: Likely COBRA Eligibility (New York: The Commonwealth Fund, January 2009).
Figure 26. Even With ARRA Subsidies, COBRA Still Unaffordable for Individuals and Families at 150 Percent of Poverty Source: M. Broaddus et al., Measures in House Recovery Package—But Not Senate Package—Would Help Unemployed Parents Receive Health Coverage (Washington: Center on Budget and Policy Priorities, February 2009).
Figure 27. Average Family Premium as a Percentage of Median Family Income, 1999–2020 Projected Source: K. Davis, Why Health Reform Must Counter the Rising Costs of Health Insurance Premiums, The Commonwealth Fund, August 2009.
Figure 28. Average Annual Savings per Family Under Health Reform That Controls Premium Growth, 2020 Savings in health care spending compared with projected trends Family Income ($ thousands) Data: Estimates by The Lewin Group for The Commonwealth Fund. Source: The Commonwealth Fund Commission on a High Performance Health System, The Path to a High Performance U.S. Health System: A 2020 Vision and the Policies to Pave the Way (New York: The Commonwealth Fund, February 2009).