Download
1 / 28
280 likes | 468 Views
Earth’s Orbit: Temperature and Sunlight .

E N D
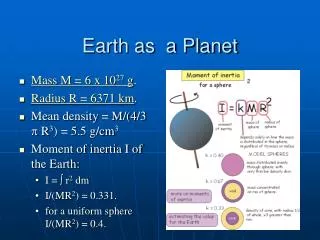
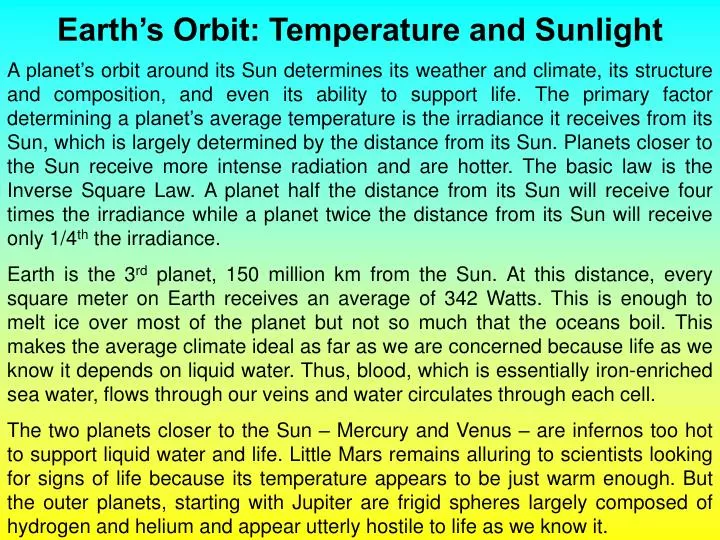
Earth’s Orbit: Temperature and Sunlight A planet’s orbit around its Sun determines its weather and climate, its structure and composition, and even its ability to support life. The primary factor determining a planet’s average temperature is the irradiance it receives from its Sun, which is largely determined by the distance from its Sun. Planets closer to the Sun receive more intense radiation and are hotter. The basic law is the Inverse Square Law. A planet half the distance from its Sun will receive four times the irradiance while a planet twice the distance from its Sun will receive only 1/4th the irradiance. Earth is the 3rd planet, 150 million km from the Sun. At this distance, every square meter on Earth receives an average of 342 Watts. This is enough to melt ice over most of the planet but not so much that the oceans boil. This makes the average climate ideal as far as we are concerned because life as we know it depends on liquid water. Thus, blood, which is essentially iron-enriched sea water, flows through our veins and water circulates through each cell. The two planets closer to the Sun – Mercury and Venus – are infernos too hot to support liquid water and life. Little Mars remains alluring to scientists looking for signs of life because its temperature appears to be just warm enough. But the outer planets, starting with Jupiter are frigid spheres largely composed of hydrogen and helium and appear utterly hostile to life as we know it.
Sunshine and Temperature on Earth Distance to the Sun is the main factor that determines temperature differences between planets. But temperatures on each planet are driven by variations of sunshine (Solar Irradiance or Insolation) that differ over latitude and over the seasons. These variations are determined by three main factors, namely 1. Angle (Height) of the Sun in the Sky 2. Hours of Daylight 3. Distance to the Sun (least important factor!) These factors are themselves determined by 2 geometrical laws of Solar Irradiance, 1. Inverse Square Law of Distance 2. Zenith Angle Cosine Law which are linked to Earth’s Orbit. At present, Earth is closest to the Sun (perihelion) on Jan 3 and furthest (aphelion) on July 4. The noon Sun appears overhead furthest north (23.5° N Lat) on about June 21 (North Hemisphere Summer Solstice and longest day) and furthest south (-23.5° S Lat) on about Dec 21 (North Hemisphere Winter Solstice and shortest day). Latitude and Mean Annual Temperature (T) Over the year all places on Earth get 50% daylight and 50% night so that mean annual T is determined by the average height of the Sun in the sky, which is greatest at the Equator and decreases to a minimum at the Poles. Thus mean annual T decreases from Equator to the Poles. Summer vs Winter Since summer occurs in July in the North Hemisphere and January in the South Hemisphere, Summer occurs when the Sun is highest in the sky and daylight hours are longest.
Definitions 1. Radiation = Propagation of electromagnetic energy through free space. 2. Irradiance = Flow (Flux) Intensity of radiant energy (Units W m-2) 3. Insolation = Solar irradiance striking Earth. 4. Declination = Latitude at which the Sun strikes overhead 5. Terrestrial Radiation = Infrared radiation emitted by the Earth. 6. Albedo = Fraction of radiation that is reflected by an object 7. Zenith Angle = Angle (of Sun, etc.) from top of sky. 8. Equinoxes = Days when day = night = 12 hours over all Earth. 9. Solstices = Days of extreme declination Dec21 and June 21. 10. Aphelion = Day when Earth is furthest from Sun July 4. 11. Perihelion = Day when Earth is closest to Sun Jan 3.
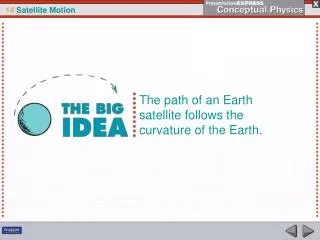
Recall the Scale of Earth’s Orbit and the Sun When we zoom out to the scale of Earth’s Orbit, the Sun looks like a tiny grain and Earth is 1/5th the size of the blue dot. From Earth, the Sun appears like a pea viewed from arm’s length - a circle of blinding light slightly more than ½ degree (0.53)wide. SUN EARTH ON JUL 4 . EARTH ON JAN 3 107 km Three observations resulting from this picture have important consequences. 1: All points on Earth (Poles and Equator) are almost the same distance from the Sun. 2: Earth is closest to the Sun on January 3 and furthest from it on July 4 3: All sunbeams striking any part of Earth are essentially parallel. What are the consequences? 1: The height of the Sun in the sky makes the Poles colder than the Equator. 2: The height of the Sun in the sky and the length of the day make the seasons. 3: This will help us understand rainbows and day and night on Earth.
Mar 21 June 21 Dec 21 Plane of Earth’s Orbit 23.5 Sept 21 Plane of Earth’s Equator Tilt of Earth’s Orbit with Respect to Earth’s Equator: Obliquity of the Ecliptic The plane that slices through Earth’s Equator is tilted at a 23.5 angle from the plane that slices through Earth’s Annual Orbit about the Sun. Because of this tilt, the North Pole is lit on June 21 and dark on Dec 21, while the opposite is true for the South Pole. This tilt is responsible for the seasons and possibly for life on Earth as well. In this figure you only see the night half of Earth on Sept 21 and the day half on March 21. On June 21 and Dec 21 you see that the half of Earth facing Sun is lit. This drawing is not to scale: Both Sun and Earth are too large compared to the orbit.
Sep 21 Earth’s Orbit and the Seasons The plane of Earth’s Equator passes through the Sun only on the Equinoxes December 21Summer Solsticeat the South Pole. North Pole lies in darkness. March 21 or Sept 21Equinoxes: Sun strikes directly overhead at the Equator and is on the horizon at the Poles. June 21 Summer Solstice at the North Pole. South Pole lies in darkness. Dec 21 Jun 21 Mar 21 Sep 21 Dec 21 Jun 21 Mar 21 Kepler’s Law Sep 21 Dec 21 Jun 21 Mar 21
Earth’s Orbit and The Seasons: Declination June The Sun appears to move north and south with the seasons. On about June 21, the Sun reaches its northern-most latitude, 23.45o. d The latitude where the Sun is overhead is called thedeclination, d = D. Yellow and blue dotted lines mark the hours. All along the dividing line between day and night the Sun rises in the NE. All latitudes in the North Hemisphere receive more hours of day than night while night is longer in the South Hemisphere
Earth’s Orbit and The Seasons: Declination Dec d Declination On about Dec 21, the Sun reaches its southernmost latitude, -23.45o. This is the first day of winter in the North Hemisphere. The North Pole lies in darkness, the South Pole in light. In December, all latitudes in the North Hemisphere receive fewer hours of day than night while day is longer in the South Hemisphere
Declination Angle, d: Annual Cycled 23.5cos(# Days from June 21) Summary of the latitude that the Sun is Overhead on Earth over the year. Click to Animate June 21 Sep 21 Dec 21
How to Draw Sunlight on Earth Click to Animate North Pole 1. Draw a Ball 2. Draw Parallel Light Beams 3. Brighten half of ball facing light – this is day 24 h day Equator Overhead Point d = D Day Night 24 h night 4. Put a dot at point where light strikes directly. 5. Choose day of year (i. e., value of declination, d). 6. Draw Equator (d from overhead point) 7. Draw Poles 90 from Equator 8. Draw regions of 24 hours of day and night around Poles South Pole
The Sun’s Path Across the Sky: View from Earth The previous slides showed the Sun and Earth from space. Now we view the Sun’s path across the sky from Earth. The link between the two views is the small celestial hemisphere shown in the slide after next. Long before anyone suspected that Earth revolves about the Sun, people traced the Sun's path across the sky. Using the sun paths they built sundials to tell time. If we know how to make the sun path, we can orient ourselves no matter where we are on Earth. We can also tell how high the Sun gets in the sky and how many hours of sunlight a place gets each day. The Sun burns an imaginary path on the celestial hemisphere, our view of the heavens. It rises in the eastern part of the sky and sets in the western part. But it only rises due east and sets due west on the two equinoxes. For the half year after March 21, the Sun rises in the northeast and sets in the northwest. For the six months after September 23 it rises in the SE and sets in the SW. Outside the tropics, the Sun crosses the sky from left to right in the North Hemisphere and from right to left in the South Hemisphere. In the Tropics the Sun rises almost straight up, stands near the zenith at noon and then sinks almost straight down so that it gets dark quite soon after sunset.
Hourly positions of the Sun above Bursa, Turkey from winter solstice in December (bottom track) to equinox (middle track) to summer solstice in June (top track). In December, the Sun stayed low in the sky and day was short. This lack of Sun caused winter. In June, the high Sun and long day caused summer. Note that the three sun path are parallel Noon 40.19 N Lat
Finding Z at Noon f = L = Latitude d = D = Declination Finding Z at Noon on any day. Sun paths are needed to find Z at other times of the day.
Recipe for Constructing Sun Paths Start with the Equinox Sun Path because… Z=0 RUN SUN PATH Choose Latitude, L = f = 53 (N>0) f Z=-30 Warning: South Latitude (S<0) Z=-60 These are zenith angles, not latitudes W 53 N Z = -90 Z = 90S E …on the Equinoxes 1. Sun rises due East and sets due West [Draw (red) circles] 2. Noon Sun is at angle Z = Latitude from the Zenith on the N-S line that goes through the Zenith [Draw (yellow) circle] 3. Draw the Equinox Sun Path by Connecting the Dots.
Then Construct the Sun Path For Any Other Day. Note: All Sun Paths are Parallel to the Equinox Path Z=0 Choose Jul 21d = 20.4 Z=-30 These are zenith angles, not latitudes d Z=-60 W N Z = -90 Z = 90S E On All Other Days 4. Draw noon Sun displaced by –d from equinox so that Z = L – d. 5. Draw Sun path (Solid Curve) parallel to (dashed) Equinox Sun path.
Maximizing Solar Power Solar voltaic panels are made of materials such as silicon and cadmium telluride, which convert sunlight directly to electricity. Parabolic reflectors aim all the sunlight at the focus, where heat is so intense that it produces steam, which drives turbines that generate electricity. Solar panels and parabolic reflectors produce the most energy when they face the Sun directly. Therefore, many are mounted on Sun-facing devices that turn as the sun moves around the sky and therefore act much like sun dials and astronomical observatories. Power is greatest when the Sun is near the zenith because that is when the path through the thin atmosphere and the losses due to scattering and absorption of light are smallest. Some solar power plants cover hundreds of acres and generate megawatts.
Geometric Laws of Irradiance Irradiance is the rate that energy flows across a screen divided by the screen’s area. Its units are Watts per square meter or W m-2. The irradiance of direct sunshine 1367 W m-2 when Earth is at its mean distance from the Sun. A light such as the Sun may emit energy at a constant rate, but a screen will intercept more or less of that energy depending on its distance to the light and its orientation relative to the light. The screen will intercept the most energy (irradiance on the screen will be greatest) when it is closest to the light and faces it directly (at a 90 angle). This gives birth to two geometrical laws of irradiance discussed and illustrated on the next slides. 1: The inverse square law (relates irradiance to distance from the light). 2: The cosine law (relates irradiance to angle between the light and screen).
Sunshine and Temperature on Earth: Distance to Sun For Earth - Sun d0 = 149.5(10)6 km I0 = 1370 W m-2 Because Earth’s orbit is an ellipse distance to sun varies over the year dd = # of days from July 4
Sunshine and Temperature on Earth: Zenith Angle Width of Sunbeam striking a specified area of ground Sunlight varies over the Earth producing variations of temperature, density and pressure
Cosine Law of Sunshine Intensity When the Sun is overhead, 100% of a beam of width, I0 strikes a piece of ground of width, I0. Click to Begin Animation I0 As the Sun goes down and Zenith Angle, Z increases, progressively less of the sunbeam of width I0, strikes the piece of ground. More of the sunbeam misses that piece of ground and is lost. I0 Z The fraction of the sunbeam that strikes the ground = IZ/I0, which trigonometry shows is equal to cos(Z). Hence the Cosine Law LOST LIGHT LIGHT ON GROUND I0 Z h I0 h Z COSINE LAW IZ Z GROUND IZ
Measuring the Sun’s Zenith Angle and Irradiance Zenith Angle Z Ruler with length, r r = 20 30 cm is good Long Ruler Compass r E N c r S W Shadow Azimuth or Compass Angle Instructions 1. Align the long ruler and the short ruler with the Sun and its shadow. 2. Tilt the short ruler until it produces the longest shadow. 3. Sun’s relative Irradiance = r/C (100%), where C is the maximum shadow length. 4. Sun’s zenith angle, Z = cos-1(r/C) = angle whose cosine = r/C 5. For next 5 Saturdays or Sundays measure Shadow, C at 1200 EST or 1300 EDT (during Daylight Savings Time) and calculate both r/C and Z.
550 500 450 400 350 300 250 200 150 100 50 0 W m-2 Reading the Chart Example 1: On Sept 21 at 60º N Latitude, Iavg = 250 W m-2. Example 2: On Nov 21 at 30º S Latitude, Iavg = 535 W m-2.
Global Radiation, Temperature, Snow Cover: Annual Cycle The following slides display annual cycles of measured Global 1: Solar Radiation 2: Surface Temperature 3. Precipitation 4: Snow Cover. As the belt of most intense radiation moves north from December to June and then back south from June to December, the patterns of temperature, precipitation and snow cover follow, but with smaller excursions and a lag of about 1-2 months (since it takes time to heat and cool the Land, Ocean and Atmosphere). All these world maps and more concerning global energetics come from the web site, http://geography.uoregon.edu/envchange/clim_animations/ All data for these maps is based on the NCEP (National Center for Environmental Prediction) Reanalysis.