Download
1 / 13
130 likes | 147 Views
Utilizing MODIS-Aqua Ocean Radiance Data to enhance insight on light propagation, phytoplankton groups, and ocean variables. Implementing NASA Ocean Biogeochemical Model to analyze Chlorophyll, Primary Production, and more.

E N D
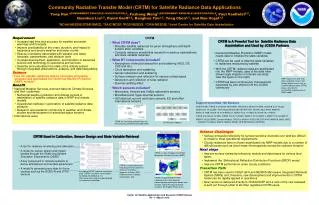
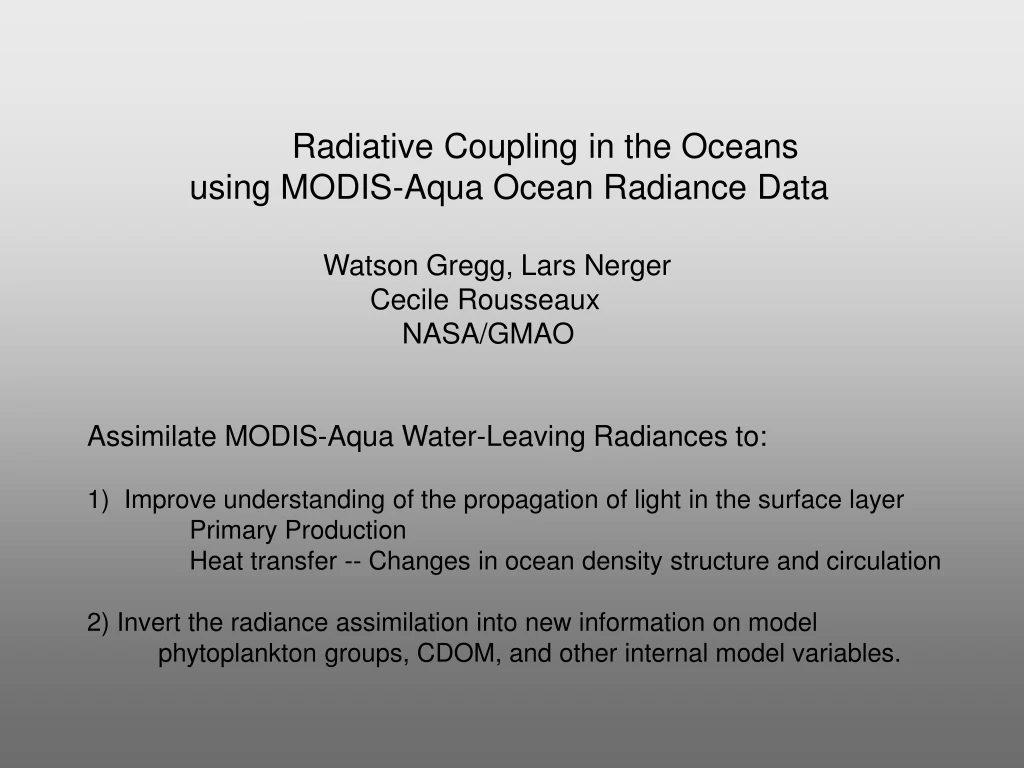
Radiative Coupling in the Oceans using MODIS-Aqua Ocean Radiance Data Watson Gregg, Lars Nerger Cecile Rousseaux NASA/GMAO Assimilate MODIS-Aqua Water-Leaving Radiances to: 1) Improve understanding of the propagation of light in the surface layer Primary Production Heat transfer -- Changes in ocean density structure and circulation 2) Invert the radiance assimilation into new information on model phytoplankton groups, CDOM, and other internal model variables.
NASA Ocean Biogeochemical Model (NOBM) Chlorophyll,Phytoplankton Groups Primary Production Nutrients DOC, DIC, pCO2 Spectral Irradiance/Radiance Outputs: Winds SST Shortwave Radiation Dust (Fe) Sea Ice Winds, ozone, humidity,pressure, precip. water, clouds, aerosols Radiative Model (OASIM) Ed Es Ed Es Layer Depths IOP, Eu Biogeochemical Processes Model Circulation Model Temperature, Layer Depths Advection-diffusion
OASIM CO2 Water vapor Ozone Oxygen Molecules, aerosols LwN Ed Ed, Es Es Ed Es Ed, Es air sea Surface Clear Sky Spectral Irradiance (PAR wavelengths): RMS=6.6% Integrated PAR: RMS=5.1% Total Surface Irradiance (direct+diffuse; spectrally integrated; clear/cloudy): bias=1.6 W m-2 (0.8%) RMS=20.1 W m-2 (11%) r=0.89 (P<0.05) Eu (1 - ) Es (1 - ) Ed
Modeling Water-Leaving Radiances (with assimilated chlorophyll) Tropical Rivers (CDOM) mW cm-2 um-1 sr-1 Cocco- lithophores
Objective 2: Invert the radiance assimilation into new information on model phytoplankton groups, CDOM, and other internal model variables. 412 550 667 443 488 CDOM detritus MODIS-Aqua Upwelling Radiance (Inverse Model) 450 350 375 400 425 475 500 525 550 575 600 625 650 675 700 OASIM Upwelling Irradiance (Forward Model) a(λ), bb(λ) ap(λ), bbp(λ) aw(λ), bbw(λ) Chlorophyll components: diatoms chlorophytes cyanobacteria coccolithophores water ad(λ), bbd(λ) aCDOM(λ)
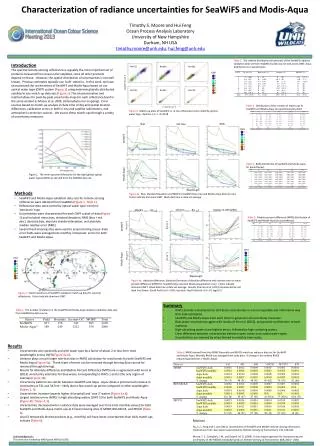
Consistent Ocean Chlorophyll from NPP/VIIRS NPP Science Team for Climate Data Records Watson W. Gregg and Nancy W. Casey • Investigate the ability of an established approach to improve the consistency of VIIRS ocean color data. • Utilizes completely processed and gridded ocean color data (Level-3 Environmental Data Records): • applies in situ data for a posteriori correction, and then • applies data assimilation to correct sampling problems.
VIIRS EDRs NASA AMT NODC In situ Data Standard processing Satellite Data Derive statistical relationships to reduce bias ESRID Empirical Satellite Radiance-In situ Data Global coupled numerical model Assimilate to reduce sampling biases ESRID Reduces bias in satellite observations, and sensor-to-sensor differences. Including those due to: Radiometric calibration Band locations and widths Band misregistration Out-of-band effects/crosstalk (mostly) Algorithms Orbit Gregg, et al., 2009, Remote Sensing of Environment Assimilated Data ESRID-Assimilated VIIRS Ocean Color Data
ESRID Empirical Satellite Radiance-In situ Data Algorithm Bias Uncertainty w/h = withholding of in situ data log bias and uncertainty in parentheses
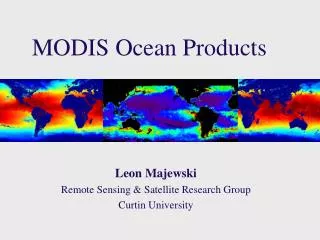
Global Annual Median Chlorophyll circa 2007 Processing ESRID improves consistency between disparate data sets Unifies the representation of ocean biology from ships and satellites Gregg and Casey, Geophysical Research Letters, 2010
Sampling Differences/Biases mg m-3 Equatorial Atlantic North Indian Antarctic
Two-Step Process to Remove Sampling Differences: 1) Remove high aerosol regions and tropical river regions (Equatorial Atlantic) Aerosol optical thickness limit = 0.4 globally = 0.3 North Central/ South Atlantic Data eliminated Equatorial Atlantic = 0.3 North/ Equatorial Indian
Step 2: Assimilate to backfill missing regions/seasons ESRID-Assimilated Global Annual Median Chlorophyll for MODIS-Aqua mg m-3 Global Annual Median Chlorophyll for MODIS-Aqua