Download
1 / 10
150 likes | 411 Views
Market Trend Analysis. { By: Han Zhen Liu. Department of the Interior: 2010 to 2013. Presentation Rundown. (2010-2013) Where were the market opportunities? Spending trend of Department of the Interior. Spending trend of subagencies .

E N D
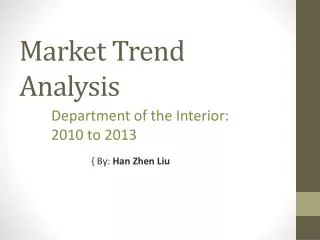
Market Trend Analysis { By: Han Zhen Liu Department of the Interior: 2010 to 2013
Presentation Rundown (2010-2013) Where were the market opportunities? • Spending trend of Department of the Interior. • Spending trend of subagencies. • Which business categories the agency is spending money on. • Geographically, where is the money going to?
Spending Trend in the Department of the Interior {We see a 18% decrease in agency spending from 2010 and 2013}
Spending Trend of Subagencies {Biggest fluctuation in agency spending from orange and light blue agencies. Rest of the subagencies retained relatively stable spending patterns}
Comparing Contract Ceilings Blue Spending: 580,105,639 Blue Ceiling: 639,952,614 Orange Spending: 65,897,209 Orange Ceiling: 37,754,271 Blue Spending: 618,364,588 Blue Ceiling: 625,557,818 Orange Spending: 113,824,708 Orange Ceiling: 165,848,155 Blue Spending: 177,896,645 Blue Ceiling: 42,632,416 Orange Spending: 508,771,438 Orange Ceiling: 3,018,500,157 Blue Spending: 0 Blue Ceiling: 0 Orange Spending: 692,837,968 Orange Ceiling: 746,657,883
Spending Trend of Business Categories – Office of Policy, Management, and Budget {Orange subagency spending focused in technologies and social care. Particularly on computer related services and research.}
Spending Trend of Business Categories – Office of Policy, Budget, and Administration {Blue subagency fade out of existence after 2012. Agency spending on outpatient mental health and substance abuse center stopped.}
Which States is the Money at? {Orange subagency spending focus in California, Virginia, and DC.}
Which State is the Money At? {Similar spending trend is seen at the agency level.}
To conclude… • From 2010 to 2013, we see a shrink in agency spending from the Department of the Interior because of the elimination of the office of policy, budget, and administration and its related spending. The office of policy, management, and budget took over the previous agency’s functions and asteady growth in agency spending in tech services and social care is observed.Agency spending is mainly focused in California, Virginia, and District of Columbia.