Download
1 / 34
390 likes | 693 Views
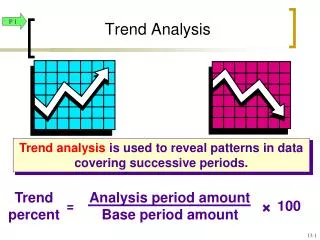
Trend percent. Analysis period amount Base period amount. ×. 100. =. Trend Analysis. P 1. Trend analysis is used to reveal patterns in data covering successive periods. 13- 1. Item. 2011. 2010. 2009. 2008. 2007. Revenues. $. 400,000. $. 355,000. $. 320,000. $. 290,000.

E N D
Trend percent Analysis period amount Base period amount × 100 = Trend Analysis P 1 Trend analysisis used to reveal patterns in data covering successive periods. 13-1
Item 2011 2010 2009 2008 2007 Revenues $ 400,000 $ 355,000 $ 320,000 $ 290,000 $ 275,000 Cost of sales 285,000 250,000 225,000 198,000 190,000 Gross profit 115,000 105,000 95,000 92,000 85,000 Item 2011 2010 2009 2008 2007 Revenues 105% 100% Cost of sales 104% 100% Gross profit 108% 100% Trend Analysis P 1 Berry Products Income Information For the Years Ended December 31, 13-2
Since we are measuring the amount of the change between 2011 and 2010, the dollar amounts for 2010 become the “base”period amounts. Comparative Statements P 1 Calculate Change in Dollar Amount Dollar change Analysis period amount Base period amount – = Calculate Change as a Percent Percent change Dollar change Base period amount × 100 = 13-3
P 1 CLOVER CORPORATION Comparative Income Statements For the Years Ended December 31, 2011 Dollars Percent 2011 2010 Change Change Revenues $520,000 $480,000 $40,000 8.3% Costs and expenses: Cost of sales 360,000 315,000 Selling and admin. 128,600 126,000 Interest expense 6,400 7,000 Income before taxes $25,000 $32,000 Income taxes (30%) 7,500 9,600 Net income $17,500 $22,400 Net income per share $0.79 $1.01 Avg. # common shares 22,200 22,200 Percent changes rounded to first decimal point. 13-4
CLOVER CORPORATION Comparative (partial) Balance Sheet December 31, 2011 Dollar Percent 2011 2010 Change Change* Assets Current assets: Cash and equivalents $ 12,000 $ 23,500 Accounts receivable, net 60,000 40,000 Inventory 80,000 100,000 Prepaid expenses 3,000 1,200 Total current assets $ 155,000 $ 164,700 Property and equipment: Land 40,000 40,000 - Buildings and equipment, net 120,000 85,000 Total property and equipment $ 160,000 $ 125,000 Total assets $ 315,000 $ 289,700 * Percent rounded to first decimal point. P 1 13-5
Financial Statement Base Amount Balance Sheet Total Assets Income Statement Revenues Common-Size Statements P 2 Calculate Common-size Percent Common-size percent Analysis amount Base amount × = 100 13-6
CLOVER CORPORATION Common-Size Comparative Income Statements For the Years Ended December 31, 2011 Common-size Percents* 2011 2010 2011 2010 Revenues $ 520,000 $ 480,000 100.0% Costs and expenses: Cost of sales 360,000 315,000 69.2% Selling and admin. 128,600 126,000 Interest expense 6,400 7,000 Income before taxes $ 25,000 $ 32,000 Income taxes (30%) 7,500 9,600 Net income $ 17,500 $ 22,400 Net income per share $ 0.79 $ 1.01 Avg. # common shares 22,200 22,200 * Rounded to first decimal point. P 2 13-7
CLOVER CORPORATION Common-Size Comparative (Partial) Balance Sheet December 31, 2011 Common-size Percents* 2011 2010 2011 2010 Assets Current assets: Cash and equivalents $ 12,000 $ 23,500 3.8% 8.1% Accounts receivable, net 60,000 40,000 Inventory 80,000 100,000 Prepaid expenses 3,000 1,200 Total current assets $ 155,000 $ 164,700 Property and equipment: Land 40,000 40,000 Buildings and equipment, net 120,000 85,000 Total property and equipment $ 160,000 $ 125,000 Total assets $ 315,000 $ 289,700 * Percent rounded to first decimal point. P 2 13-8
Liquidity and Efficiency P 3 Use this information to calculate the liquidity and efficiency ratios for Norton Corporation. 13-9
Dec. 31, 2011 Current assets $ Current liabilities Working capital $ Working Capital P 3 Working capitalrepresents current assets financed from long-term capital sources that do not require near-term repayment. 13-10
Current ratio Current assets Current liabilities = Current ratio $ = = Current Ratio P 3 This ratio measures the short-term debt-paying ability of the company. 13-11
Quick assetsCurrent liabilities Acid-test ratio = Acid-test ratio = = Acid-Test Ratio P 3 Quick assets are Cash, Short-Term Investments,and Current Receivables. This ratio is like the current ratio but excludes current assets such as inventories and prepaid expenses that may be difficult to quickly convert into cash. 13-12
Accounts receivable turnover Net sales Averageaccounts receivable/net = Accounts receivable turnover = = Accounts Receivable Turnover P 3 This ratio measures how many times a company converts its receivables into cash each year. 13-13
Days’ Sales Uncollected P 3 A/R, net Net sales Days’ sales uncollected = ´ 365 Days’ sales uncollected = ´ This ratio measures the liquidity of receivables. 13-14
Inventory turnover Cost of goods sold Averageinventory = Inventory turnover $ = Inventory Turnover P 3 This ratio measures the number of times merchandise is sold and and replaced during the year. 13-15
Days’ sales in inventory Ending inventory Cost of goods sold = ´ 365 Days’ sales in inventory = ´ Days’ Sales in Inventory P3 This ratio measures the liquidity of inventory. 13-16
Total asset turnover Net sales Average total assets = Total asset turnover = = Total Asset Turnover P 3 This ratio measures the efficiency of assets in producing sales. 13-17
Solvency P 3 Debt Ratio Equity Ratio Pledged Assets to Secured Liabilities Times Interest Earned 13-18
Solvency P 3 Use this information to calculate the solvency ratios for Norton Corporation. 13-19
Total liabilities = Total assets Debt ratio $ Debt ratio Debt Ratio P 3 This ratio measures what portion of a company’s assets are contributed bycreditors. 13-20
Total equity = Total assets Equity ratio $ Equity ratio = Equity Ratio P 3 This ratio measures what portion of a company’s assets are contributed byowners. 13-21
Debt-to-equity-ratio Total liabilities = Total equity Debt-to-equity-ratio = Debt-to-Equity Ratio P 3 $ = This ratio measures the solvency of companies. 13-22
Income before interest expense and income taxes Interest expense Times interest earned = Times interest earned = = Times Interest Earned P 3 This is the most common measure of the ability of a firm’s operations to provide protection to the long-term creditor. 13-23
Profitability P 3 Use this information to calculate the profitability ratios for Norton Corporation. 13-24
Profit margin Net income Net sales = Profit margin = = Profit Margin P 3 This ratio describes a company’s ability to earn a net income from sales. 13-25
Gross margin Net sales - Cost of sales Net sales = Gross margin = = Gross Margin P 3 This ratio measures the amount remaining from $1 in sales that is left to cover operating expenses and a profit after considering cost of sales. 13-26
Return on total assets Net income Averagetotal assets = Return on total assets = = Return on Total Assets P 3 This ratio is generally considered the best overall measure of a company’s profitability. 13-27
Return on common stockholders’ equity Net income - Preferred dividendsAveragecommon stockholders’ equity = Return on common stockholders’ equity = = Return on Common Stockholders’ Equity P 3 This measure indicates how well the company employed the owners’ investments to earn income. 13-28
Book value per common share Shareholders’ equity applicable to common shares Number of common shares outstanding = Book Value per Common Share P 3 This ratio measures liquidation at reported amounts. 13-29
Basic earnings per share Net income - Preferred dividends weighted-averagecommon shares outstanding = Basic earnings per share $ = = Basic Earnings per Share P 3 This measure indicates how much income was earned for each share of common stock outstanding. 13-30
Market Prospects P 3 Use this information to calculate the market ratios for Norton Corporation. 13-31
Price-earnings ratio Market price per common share Earnings per share = Price-earnings ratio = = Price-Earnings Ratio P 3 This measure is often used by investors as a general guideline in gauging stock values. Generally, the higher the price-earnings ratio, the more opportunity a company has for growth. 13-32
Dividend yield Annual cash dividends per share Market price per share = Dividend yield = = 13.3% Dividend Yield P 3 This ratio identifies the return, in terms of cash dividends, on the current market price of the stock. 13-33
Summarizing Results A1 A financial statement analysis report helps by directly assessing the building blocks of analysis and by identifying weaknesses in inference and by requiring explanation. It usually consists of six sections: • Executive summary • Analysis overview • Evidential matter • Assumptions • Key Factors • Inferences 13-34