1 / 1
10 likes | 36 Views
Get this How-To Guide and access over 350 premium-quality tools & templates for business at https://www.demandmetric.com/user/register JOIN FREE to get practical on-the-job resources and training plus all of our guides, methodologies, webinars and featured tools & templates.

E N D
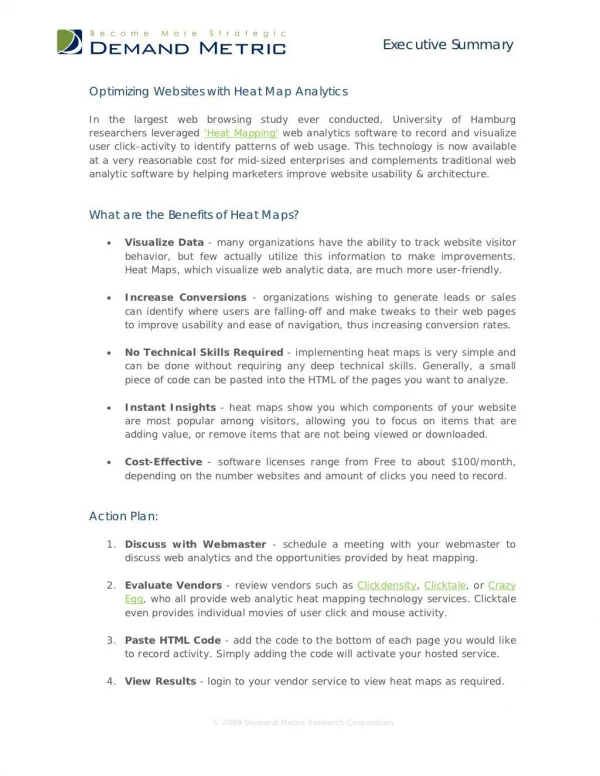
Optimizing Websites with Heat Map Analytics Executive SummaryOptimizing Websites with Heat Map AnalyticsIn the largest web browsing study ever conducted, University of Hamburgresearchers leveraged Heat Mapping web analytics software to record and visualizeuser click-activity to identify patterns of web usage. This technology is now availableat a very reasonable cost for mid-sized enterprises and complements traditional webanalytic software by helping marketers improve website usability & architecture.What are the Benefits of Heat Maps? • Visualize Data - many organizations have the ability to track website visitor behavior, but few actually utilize this information to make improvements. Heat Maps, which visualize web analytic data, are much more user-friendly. • Increase Conversions - organizations wishing to generate leads or sales can identify where users are falling-off and make tweaks to their web pages to improve usability and ease of navigation, thus increasing conversion rates. • No Technical Skills Required - implementing heat maps is very simple and can be done without requiring any deep technical skills. Generally, a small piece of code can be pasted into the HTML of the pages you want to analyze. • Instant Insights - heat maps show you which components of your website are most popular among visitors, allowing you to focus on items that are adding value, or remove items that are not being viewed or downloaded. • Cost-Effective - software licenses range from Free to about $100/month, depending on the number websites and amount of clicks you need to record.Action Plan: 1. Discuss with Webmaster - schedule a meeting with your webmaster to discuss web analytics and the opportunities provided by heat mapping. 2. Evaluate Vendors - review vendors such as Clickdensity, Clicktale, or Crazy Egg, who all provide web analytic heat mapping technology services. Clicktale even provides individual movies of user click and mouse activity. 3. Paste HTML Code - add the code to the bottom of each page you would like to record activity. Simply adding the code will activate your hosted service. 4. View Results - login to your vendor service to view heat maps as required. © 2009 Demand Metric Research Corporation