1 / 24
240 likes | 274 Views
The Demand Metric 2013 Marketing Analytics Survey was administered online over a period of April 17th through May 3rd, 2013. During that time, over 700 responses were collected, 622 of which were complete. A key marketing challenge is demonstrating value and relevance. Marketers generally agree that marketing analytics can help marketers measure their contribution to the organizations they serve. In April 2013, Demand Metric conducted a benchmarking study to examine how marketing analytics is being adopted, adding value, and becoming integrated into overall marketing strategy. A survey was used to collect data, and its analysis provides these key findings: - World leaders: North American organizations lead the world in meaningful marketing analytics initiatives - Size matters: large organizations are having more marketing analytics success than SMBs. - Money talks: those who are allocating greater portions of marketing budgets are getting more from their analytics initiatives. - Keeping it in the family: analytics data is largely staying inside the marketing department. - Perception isn’t reality: CEOs, presidents, SVPs and business owners have a significantly higher opinion of the credibility of marketing analytics data than do members of the marketing organization. This report details the results and insights from the analysis of the study data.

E N D
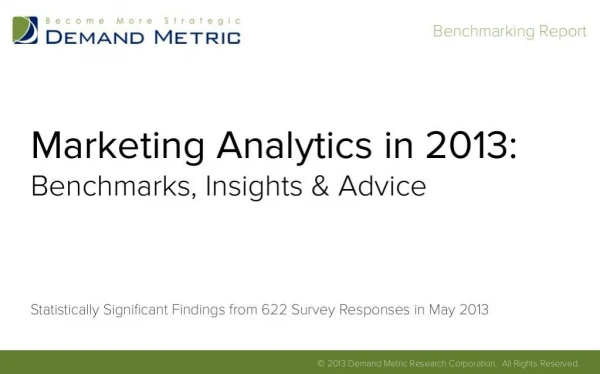
Marketing Analytics in 2013 Benchmarking Report Benchmarking Report Marketing Analytics in 2013:Benchmarks, Insights & AdviceStatistically Significant Findings from 622 Survey Responses in May 2013© 2013 Demand Metric Research Corporation. All Rights Reserved.
EXECUTIVE SUMMARYA key marketing challenge is demonstrating value and relevance. Marketers generally agree that marketinganalytics can help marketers measure their contribution to the organizations they serve. In April 2013, Demand Metric conducted a benchmarking study to examine how marketing analytics is beingadopted, adding value, and becoming integrated into overall marketing strategy.A survey was used to collect data, and its analysis provides these key findings: § World leaders: North American organizations lead the world in meaningful marketing analytics initiatives§ Size matters: large organizations are having more marketing analytics success than SMBs.§ Money talks: those who are allocating greater portions of marketing budgets are getting more from theiranalytics initiatives.§ Keeping it in the family: analytics data is largely staying inside the marketing department.§ Perception isn’t reality: CEOs, presidents, SVPs and business owners have a significantly higher opinion ofthe credibility of marketing analytics data than do members of the marketing organization. This report details the results and insights from the analysis of the study data.Benchmarking Report EXECUTIVE SUMMARYA key marketing challenge is demonstrating value and relevance. Marketers generally agree that marketinganalytics can help marketers measure their contribution to the organizations they serve. In April 2013, Demand Metric conducted a benchmarking study to examine how marketing analytics is beingadopted, adding value, and becoming integrated into overall marketing strategy.A survey was used to collect data, and its analysis provides these key findings: § World leaders: North American organizations lead the world in meaningful marketing analytics initiatives§ Size matters: large organizations are having more marketing analytics success than SMBs.§ Money talks: those who are allocating greater portions of marketing budgets are getting more from theiranalytics initiatives.§ Keeping it in the family: analytics data is largely staying inside the marketing department.§ Perception isn’t reality: CEOs, presidents, SVPs and business owners have a significantly higher opinion ofthe credibility of marketing analytics data than do members of the marketing organization. This report details the results and insights from the analysis of the study data.Benchmarking Report
Benchmarking Report 1) Research Methodology2) State of Marketing Analytics3) Attitude Toward Marketing Analytics4) Biggest Challenges5) Use of Marketing Analytics Data6) Budget Allocation7) Impact of Marketing Analytics8) Influence on Decision Making9) Credibility of Data & Insights10) Chief Analyst Bottom Line11) Acknowledgements12) About Demand Metric BenchmarkingTABLE OF CONTENTS Benchmarking Report 1) Research Methodology2) State of Marketing Analytics3) Attitude Toward Marketing Analytics4) Biggest Challenges5) Use of Marketing Analytics Data6) Budget Allocation7) Impact of Marketing Analytics8) Influence on Decision Making9) Credibility of Data & Insights10) Chief Analyst Bottom Line11) Acknowledgements12) About Demand Metric BenchmarkingTABLE OF CONTENTS
RESEARCH METHODOLOGYThe Demand Metric 2013 Marketing Analytics Survey was administered online over a period of April 17th throughMay 3rd, 2013. During that time, over 700 responses were collected, 622 of which were complete.All members of the Demand Metric community received email invitations to participate in the survey, andparticipation was encouraged through a random draw incentive for an iPad Mini.While respondent email addresses were collected in order to facilitate the prize drawing, no identifyinginformation was retained or considered in the analysis of the survey data.Following collection of the survey data, Demand Metric used IBM SPSS statistics software to analyze the resultsand draw statistically significant conclusions. Benchmarking Report 1 RESEARCH METHODOLOGYThe Demand Metric 2013 Marketing Analytics Survey was administered online over a period of April 17th throughMay 3rd, 2013. During that time, over 700 responses were collected, 622 of which were complete.All members of the Demand Metric community received email invitations to participate in the survey, andparticipation was encouraged through a random draw incentive for an iPad Mini.While respondent email addresses were collected in order to facilitate the prize drawing, no identifyinginformation was retained or considered in the analysis of the survey data.Following collection of the survey data, Demand Metric used IBM SPSS statistics software to analyze the resultsand draw statistically significant conclusions. Benchmarking Report 1
RESEARCH METHODOLOGYBenchmarking Report The information collected about the survey respondents to enable cross-tabulation analysis is summarized here: Type of Marketing Organization:§ B2B: 74%§ B2C: 26% Geographic Location:§ North America: 72%§ Europe: 11%§ Rest of World: 17% Size of Organization (# employees):§ Small (1 to 100): 53%§ Medium (101 – 1000): 30%§ Large (1000+): 17%2Job Titles: RESEARCH METHODOLOGYBenchmarking Report The information collected about the survey respondents to enable cross-tabulation analysis is summarized here: Type of Marketing Organization:§ B2B: 74%§ B2C: 26% Geographic Location:§ North America: 72%§ Europe: 11%§ Rest of World: 17% Size of Organization (# employees):§ Small (1 to 100): 53%§ Medium (101 – 1000): 30%§ Large (1000+): 17%2Job Titles:
STATE OF MARKETING ANALYTICSBenchmarking Report The first question considered in this study asks: “What statement best describes the state of marketing analyticsin your organization?” Respondents were allowed to choose one response:3This question reveals that: § 29% of respondents are doing nothing orare searching for a way to start.§ 32% of respondents are experimenting tofind the best set of analytics, but thoseanalytics are not yet influencing theorganization’s behavior or actions.§ 39% of respondents report they aretracking meaningful analytics. STATE OF MARKETING ANALYTICSBenchmarking Report The first question considered in this study asks: “What statement best describes the state of marketing analyticsin your organization?” Respondents were allowed to choose one response:3This question reveals that: § 29% of respondents are doing nothing orare searching for a way to start.§ 32% of respondents are experimenting tofind the best set of analytics, but thoseanalytics are not yet influencing theorganization’s behavior or actions.§ 39% of respondents report they aretracking meaningful analytics.
STATE OF MARKETING ANALYTICSBenchmarking Report A deeper analysis of the responses to this question yielded some additional insights about the state of marketinganalytics. The response options to this question represented a scale, where 1 equals avoidance and 5 equalsmeaningful and visible results. Using this scale to calculate the mean revealed two statistically significant gaps:Geographic: North American organizations are in the lead when it comes to the state of marketing analytics.These organizations had a mean response on this scale of 3.33, compared to 3.07 for Europe and the rest of theworld. Company size: Large companies report greater progress in this area with a mean score of 3.46, compared tosmall companies whose mean was 3.17. The data reveals more insight on the state of marketing analytics based on company size: 33 percent of smallcompanies are either avoiding marketing analytics, or are searching for the best way to start. This compares to26 percent for medium-sized organizations and only 19 percent for large companies.4 STATE OF MARKETING ANALYTICSBenchmarking Report A deeper analysis of the responses to this question yielded some additional insights about the state of marketinganalytics. The response options to this question represented a scale, where 1 equals avoidance and 5 equalsmeaningful and visible results. Using this scale to calculate the mean revealed two statistically significant gaps:Geographic: North American organizations are in the lead when it comes to the state of marketing analytics.These organizations had a mean response on this scale of 3.33, compared to 3.07 for Europe and the rest of theworld. Company size: Large companies report greater progress in this area with a mean score of 3.46, compared tosmall companies whose mean was 3.17. The data reveals more insight on the state of marketing analytics based on company size: 33 percent of smallcompanies are either avoiding marketing analytics, or are searching for the best way to start. This compares to26 percent for medium-sized organizations and only 19 percent for large companies.4
ATTITUDE TOWARD MARKETING ANALYTICSBenchmarking Report 5The second question considered in this study asks: “What best describes your attitude toward marketinganalytics?” Respondents were allowed to choose one response:These results seem to indicate that most respondents recognize the intrinsic value of marketing analytics,whether or not they have figured out how to use them effectively.A full 92% of responses acknowledge that marketing analyticsare important for managing marketing processes,demonstrating value or improving marketing’s credibility. ATTITUDE TOWARD MARKETING ANALYTICSBenchmarking Report 5The second question considered in this study asks: “What best describes your attitude toward marketinganalytics?” Respondents were allowed to choose one response:These results seem to indicate that most respondents recognize the intrinsic value of marketing analytics,whether or not they have figured out how to use them effectively.A full 92% of responses acknowledge that marketing analyticsare important for managing marketing processes,demonstrating value or improving marketing’s credibility.
BIGGEST CHALLENGESBenchmarking Report 6The third question considered in this study asks: “What is the biggest challenge with marketing analytics in yourorganization?” Respondents were allowed to choose one response: BIGGEST CHALLENGESBenchmarking Report 6The third question considered in this study asks: “What is the biggest challenge with marketing analytics in yourorganization?” Respondents were allowed to choose one response:
. BIGGEST CHALLENGESBenchmarking Report These results reveal that 94 percent of organizations are experiencing some form of challenge when it comes tomarketing analytics, and those challenges range from skills to resources to buy-in.This question revealed additional insight upon further analysis. When the responses were analyzed by job responsibility – Marketing, CEO/SVP/President/Owner and Other –they were fairly uniform except for one response: the difficulty of identifying and then tracking a meaningful setof analytics.For this response, there was a noticeable divergence of opinion, with only 12 percent of Marketing respondentschoosing this response, but 24 percent of CEO/SVP/President/Owners selecting it. This benchmarking survey didnot collect data to determine why this gap exists, but we can speculate. When it comes to marketing analytics,marketers and executives don’t speak the same language. Marketers can speak of and measure things thatdon’t always have meaning in the C-suite. This dissonance may explain this gap. The greatest challenge for large companies (33%) – having the systems and infrastructure to measure and trackanalytics – ranks third on the list of challenges for small companies (20%). However, the greatest challenge forsmall companies (27%) – having the time or staff to get it done – ranks third for large companies (17%).7
. USE OF MARKETING ANALYTICS DATABenchmarking Report 8The fourth question considered in this study asks: “What are you doing with the marketing analytics data youmeasure and track?” Respondents were allowed to choose one response:Data is of no value unless it is put to use.These results reveal that almost a one fourth (24%) of theorganizations surveyed perceive that no one is usingwhatever marketing analytics data being collected.
. USE OF MARKETING ANALYTICS DATABenchmarking Report 9A further analysis of the responses to this question revealed these insights: Most commonly (38%), marketing analytics data stays within the marketing organization, where it is used toimprove marketing results.An analysis of this 38% by company size reveals: § Marketing teams at small companies (30%) are least likely to review and use this data.§ Marketing teams at medium-sized companies (49%) are most likely to review and use this data.§ CEO/SVP/President/Owners have a much higher perception of marketing analytics data transparency andsharing (23%) than do the marketing teams that work for them (6%).There is some irony here in that the group that should best understand marketing analytics – the marketers –have the most skeptical view of this data’s transparency.
. BUDGET ALLOCATIONBenchmarking Report 10The fifth question considered in this study asks: “What percent of your marketing budget do you estimate isallocated to marketing analytics?” Respondents were allowed to choose one response:These results reveal that almost three quarters(72%) of the organizations surveyed are spendingless than 5% of their marketing budget onmarketing analytics.
. BUDGET ALLOCATIONBenchmarking Report 11These results clearly show that organizations that are investing more heavily in marketing analytics are claimingto get the most from their efforts: Just eight percent (8%) of respondents to this question are investing more than 10% of their marketing budgetson marketing analytics. Yet, when considering the state of marketing analytics in this elite group (question #1 onthe survey), 50% of them report they are tracking meaningful analytics that have visibility throughout theorganization. This maturity is almost double that for organizations spending between 6 and 10 percent of theirbudget (26%) and triple that of organizations spending less than five percent of their budget (17%). When it comes to using marketing analytics data (question #4 on the survey), it appears there is a point ofdiminishing returns. Marketing teams in organizations spending between 6 and 10 percent of their marketingbudget on marketing analytics report the highest use of this data to improve marketing results (51%), comparedwith those spending more than 10 percent of their budget (45%) and those spending less than five percent (40%).
. IMPACT OF MARKETING ANALYTICSBenchmarking Report 12The sixth question considered in this study asks: “How has your marketing analytics initiative(s) impacted yourorganization’s success?” Respondents were allowed to choose one response:These results reveal that only 21% of surveyrespondents are noticing an impact from theirmarketing analytics programs.
. Benchmarking Report 13Further analysis of the data from this question of impact revealed at least one statistically significant association:organizations that are spending more on marketing analytics are feeling a greater impact from their initiatives.Following are a few interesting insights: § Organizations spending more than 10% of their marketing budgets on marketing analytics, 55% reported“noticeable” or “substantial” impact from their efforts.§ For those spending between 6 and 10% of their marketing budgets, 38% reported this same level of impact. § For those spending less than 5% of their marketing budgets, only 15% reported this same level of impact. § For those spending nothing, only 7% reported this same level of impact.IMPACT OF MARKETING ANALYTICS
. INFLUENCE ON DECISION MAKINGBenchmarking Report 14The seventh question considered in this study asks: “When it comes to influencing decision making, what role domarketing analytics play in your organization?” Respondents were allowed to choose one response:As with the previous question on impact, there is anassociation to the marketing analytics budget allocation.87% of organizations spending more than 10% of theirbudget state that analytics are often part of the pre- or post-decision making process, or integral to it.By contrast, only 50% of organizations spending less than5% of their budget make this same claim.
. CREDIBILITY OF DATA & INSIGHTSBenchmarking Report 15The eighth and final question considered in this study asks: “How credible are marketing analytics perceived inyour organization?” Respondents were allowed to choose one response:Demand Metric’s position is that only whenmarketing analytics data is perceived “good”or “high” in terms of credibility, will anorganization trust it enough to act upon it.
. Benchmarking Report The perceived credibility of any data is perhaps the most critical factor in successfully using that data as amanagement or measurement tool. These survey results reveal that small organizations ascribe more credibilityto their marketing analytics data than do large ones: § 44% of small organizations assess the credibility of their marketing analytics data as “good” or “high”§ 30% of medium-sized organizations make this same assessment. § 28% of large organizations make this same assessment. When it comes to job title, there is a significant divergence of perception in organizations that assess thecredibility of their marketing analytics as “high”. For organizations that assessed their analytics credibility at thishighest level, 22% of CEO/SVP/President/Owners felt this way, while only 8% of their marketers made this sameassessment.This result mirrors a similar perception gap reported for marketing analytics challenges (question #3 on the survey)and data use (question #4 on the survey). The data collected and analyzed for this study offers no explanation forthese gaps between marketing and the C-suite, but Demand Metric believes it is symptomatic of communicationsissues that often plague the Marketing/CEO relationship.CREDIBILITY OF DATA & INSIGHTS16
. Benchmarking Report This study indicates that there is almost universal recognition of the value of marketing analytics, regardless ofhow effectively an organization is using them. At the same time, most organizations are experiencing challengeswhere marketing analytics are concerned, and small organizations have different challenges (time and staff) thanlarge ones (systems and infrastructure). What’s also clear is that organizations that allocate at least 6% or more of their marketing budgets to analyticsare claiming the greatest impact and highest credibility from their efforts. The organizations that are spendingmore on marketing analytics are also the ones claiming to make more data-driven decisions as a result.A troubling divergence of opinion exists between marketing teams and the CEOs, SVPs, Presidents and Ownersthat lead their organizations.In one area – the challenge of identifying and tracking meaningful analytics – the C-suite respondentsrecognized this as a greater challenge than the marketing teams that serve them. In two other areas –transparency and sharing of data, and perception of credibility – the C-suite had a much higher estimation ofsuccess than did their marketing teams.ANALYST BOTTOM LINE17
. Benchmarking Report The Demand Metric final analysis is that barriers to greater success with marketing analytics are largely cultural.Had this study examined the relationship between the marketing organization and the C-suite, we believe thatorganizations where trust, empowerment and good communication exists between these groups, thatmarketing analytics are playing a key role in driving and measuring results.Conversely, where there is friction, distrust or poor communication between marketing and the C-suite, wesuspect if marketing analytics are used at all, they are used punitively. What this study makes clear is that company leaders find marketing analytics data credible. The issue formarketers is how to best leverage the credibility of the data to improve how marketing communicates with theirorganization’s leadership. Marketers who do this best understand that marketing analytics is as much aboutcommunications as it is about calculations.ANALYST BOTTOM LINE18
. Benchmarking Report Demand Metric is grateful for those members of the Demand Metric community that took the time to provide theirinput to this study. Demand Metric acknowledges the advice and assistance of Dr. Tom Brown, Noble Foundation Chair in MarketingStrategy and Professor of Marketing in the Spears School of Business at Oklahoma State University, in facilitatingand providing counsel on the analysis of these survey results. Demand Metric also acknowledges the insights of Stephan Sorger, VP of Strategic Marketing at On DemandAdvisors, in the preparation of this benchmarking report. Stephan, a “Marketing Analytics Ambassador” andauthor of Marketing Analytics: Strategic Models and Metrics, helped inspire this study and contributed keyinsights.ACKNOWLEDGEMENTS19
. Benchmarking Report Demand Metric is a marketing advisory firm serving a membership community of over 30,000 marketingprofessionals and consultants in 75 countries with consulting methodologies, advisory services, and a library of500+ premium marketing tools and templates. Demand Metric is conducting benchmarking research to provide metrics and data on key marketing initiatives,strategies and execution. Members can use this data to benchmark their performance against their peers and getan objective view of their organizations maturity with regard to specific marketing disciplines and competencies.If you’d like to work with us to conduct or sponsor a custom research study, email us info@demandmetric.comABOUT DEMAND METRIC BENCHMARKING
. Benchmarking Report For more information, visit us at:www.demandmetric.comDemand Metric Research Corporation#300 – 1275 West 6th Avenue, Vancouver, BC CANADA V6H 1A6© 2013 Demand Metric Research Corporation. All Rights Reserved.