Download
1 / 30
300 likes | 321 Views
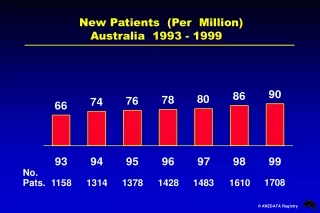
This study examines the acceptance of new patients and age-specific rates of renal replacement therapy in Australia and New Zealand from 2003-2008. It also explores comorbid conditions, smoking status, diabetes status, and biopsy rates.

E N D
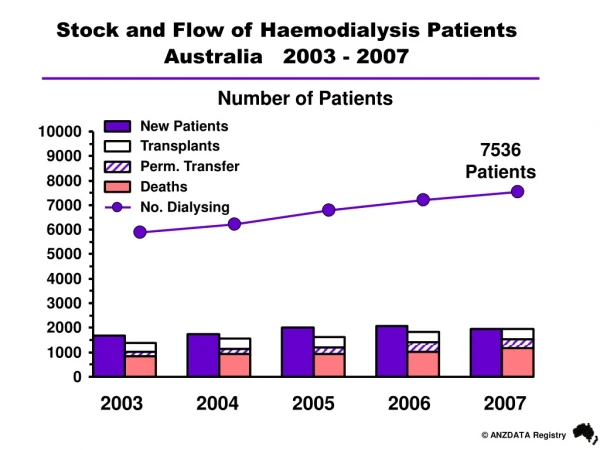
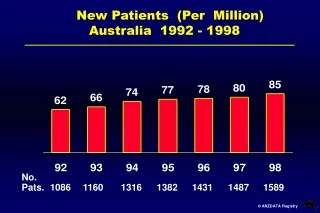
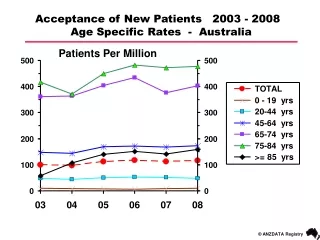
Acceptance of New Patients 2003 - 2008 Age Specific Rates - Australia Patients Per Million
Acceptance of New Patients 2003 - 2008 Age Specific Rates - New Zealand Patients Per Million
New RRT Rates - Queensland 130 120 New RRT (per million per year) 110 100 90 2002 2003 2004 2005 2006 2007 2008 Year
New RRT Rates - New South Wales 130 120 110 New RRT (per million per year) 100 90 80 2002 2003 2004 2005 2006 2007 2008 Year
New RRT Rates - ACT 140 120 New RRT (per million per year) 100 80 60 2002 2003 2004 2005 2006 2007 2008 Year
New RRT Rates - Victoria 120 110 New RRT (per million per year) 100 90 80 2002 2003 2004 2005 2006 2007 2008 Year
New RRT Rates - Tasmania 140 120 100 New RRT (per million per year) 80 60 40 2002 2003 2004 2005 2006 2007 2008 Year
New RRT Rates - South Australia 140 120 New RRT (per million per year) 100 80 60 2002 2003 2004 2005 2006 2007 2008 Year
New RRT Rates - Northern Territory 500 400 New RRT (per million per year) 300 200 2002 2003 2004 2005 2006 2007 2008 Year
New RRT Rates - Western Australia 140 130 120 New RRT (per million per year) 110 100 90 2002 2003 2004 2005 2006 2007 2008 Year
Comorbid Conditions at Entry to RRT Australia
Comorbid Conditions at Entry to RRT New Zealand
Smoking Status at Entry to RRT Australia
Smoking Status at Entry to RRT New Zealand
Diabetes Status at Entry to RRT Australia
Diabetes Status at Entry to RRT New Zealand
Biopsy Rates: Glomerulonephritis Australia
Biopsy Rates: Glomerulonephritis New Zealand
Biopsy Rates: Diabetic Nephropathy Australia
Biopsy Rates: Diabetic Nephropathy New Zealand