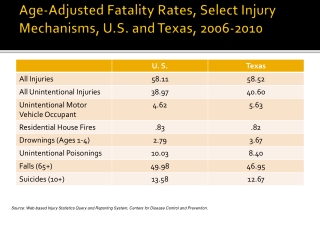
Age Adjusted Rates
Age Adjusted Rates. R.M. Pandey Additional Professor Department of Biostatistics All India Institute of Medical Sciences New Delhi. Crude Rates: a single number computed as a summary measure for an entire group disregards differences caused by age, sex and other characteristics


Age Adjusted Rates
E N D
Presentation Transcript
Age Adjusted Rates R.M. Pandey Additional Professor Department of Biostatistics All India Institute of Medical Sciences New Delhi
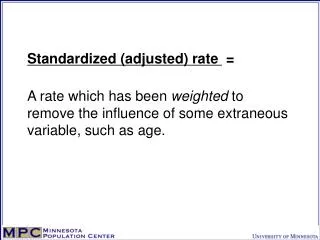
Crude Rates: • a single number computed as a summary measure for an entire group • disregards differences caused by age, sex and other characteristics • Adjusted Rates: • a single number obtained by adjusting for imbalance in age, sex and other characteristics while comparing a rate for two or more groups
Example: Hearing Impairment Due to Injury in 17+ persons Conclusion: compare the crude rates between the groups ? Is the conclusion valid ?
The groups may differ substantially with respect to age, sex and other important characteristics e.g.: two populations from different geographical areas: – (A) composed of entirely males; (B) entirely females - Can never be sure whether the difference in mortality is due to location or due to gender. Such a situation, gender is referred as a confounder, because it associated with with both location and death rate. It obscures the relationship between location and death rate.
Age-specific impairment rates: 5.80 is the weighted average of the age specific rates Age is a confounder in the relationship between hearing impairment and employment status
More accurate comparison: age-specific comparisons Rate/ 1000 3.85 7.74 8.18 6.48
More accurate comparison: age-specific comparisons Rate/ 1000 3.85 7.74 8.18 6.48 Crude rate provided an incomplete picture of the true situation
Subgroup specific rates: • More accurate comparison than crude rates • We would end up with overwhelming number of rates to compare • More Convenient: • Summarize an entire situation with a single number calculated for each subpopulation, a number that adjusts for difference in composition • Two Ways: • Direct method of standardization • Indirect method of standardization
Direct Method of Standardization: Step 1: Select the standard population. Step 2: compute the expected events that would result if , instead of having different age distributions, all populations were to have same standard age structure Step 3: Compute the adjusted rate as total expected events in the group divided by the total standard population
Age adjusted impairment rate for: Currently employed = 965.0/163,157 = 5.91 per 1,000 Not in the labor force = 904.3/163,157 = 5.54 per 1,000
Indirect Method of Standardization: Step 1: use a set of standard age-specific rates along with the actual age composition of each population Step 2: compute the number of events that would have occurred in the two groups if each took on the age specific rates of the standard population while retaining its own age distribution Step 3: compute standardized event ratio as observed/expected events for each group The indirect method often concludes with this ratio. Step 4: actual age adjusted rates for each group = event rate in the standard population x standardized event ratio of the group
Standardized event rate Currently employed = 552/536.9 = 1.03 = 103% Not in the labor force = 368/372.4 = 0.99 = 99% Age adjusted rates 5.08 x 1.03 = 5.97 5.08 x 0.99 = 5.74
Must know when to use an adjusted rate rather than crude rate • If no confounders: the crude rate is adequate • If confounders present: subgroup specific rates are sufficient • Adjusted rates should be considered if they are meaningful • If distribution of standard population is radically different than the populations being compared, standardization is inappropriate • Also, when direct standardization is applied, subgroup specific rates should have same general trends in all the groups being compared as well as in the standard population • Direct method of standardization is used more frequently than indirect method • Direct method requires subgroup specific rates for all popns. • Application of either method should lead to same conclusion