Download
1 / 17
170 likes | 192 Views
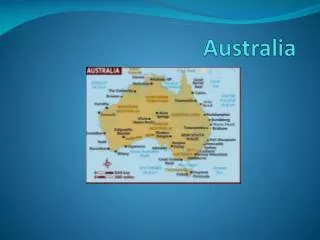
This study examines the number of new patients and their age group distribution in Australia and New Zealand from 1992 to 1998. It also analyzes the acceptance of new patients, diabetic percentages, and creatinine clearance at entry.

E N D
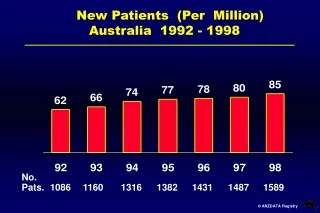
1589 1086 1160 1316 1382 1431 1487 New Patients (Per Million) Australia 1992 - 1998 No. Pats.
No. Pats. 150 287 532 430 29 114 47 New Patients (Per Million) Australian States 1998
Age of New Patients - Australia 1998 New Patients (1589) Median Age 59.5 yrs Per Million Age Group 5 6 19 41 67 112 200 317 246 18 Diabetic % 0 0 6 23 25 29 28 20 10 0 0 0 6 19 16 7 1 <1 0 0 Type 1
Acceptance of New Patients 1991 - 1998 Age Specific Rates - Australia Patients Per Million
New Patients (Per Million) New Zealand 1992 - 1998 No. Pats. 363 246 232 248 288 290 320
Age of New Patients - New Zealand 1998 New Patients (363) Median Age 57.0 yrs Per Million Age Group 0 9 30 52 65 142 354 307 115 23 0 0 0 23 42 55 63 35 12 0 Diabetic % 0 0 0 17 26 3 2 0 0 0 Type 1
Acceptance of New Patients 1991 - 1998 Age Specific Rates - New Zealand Patients Per Million
New Acceptances by RaceAustralia 1991 - 1998 Patients Per Million
New Acceptances by RaceNew Zealand 1991 - 1998 Patients Per Million
New Patients Creatinine at EntryApril 1998 - March 1999 AustraliaNew Zealand Treatment at 90 days (1516) (313) 20 years Median 790 760 25-75% 623 - 980 602 - 980 Mean ± SD 830 (314) 831 (332)
All 7 Female 6 Male 8 Diabetic 8 Non Diabetic 7 Age 25-54 8 55-64 7 65-74 7 75-84 6 QLD 7 NSW 7 VIC 7 TAS 8 SA 7 NT 7 WA 7 Aboriginal 7 Caucasoid 7 Asian 6 Median Creatinine Clearance mls/minApril 1998 - March 1999 Australia (Treatment at 90 days)
All 7 Female 6 Male 8 Age 25-54 8 55-64 8 65-74 7 75-84 6 Diabetic 8 Non Diabetic 7 Caucasoid 7 Maori 8 Pacific Islander 7 Asian 6 Median Creatinine Clearance mls/minApril 1998 - March 1999 New Zealand (Treatment at 90 days)
Female (n=639) Female (n=122) Male (n=852) Male (n=190) New Patients Creatinine Clearance at EntryApril 1998 - March 1999 % Australia New Zealand All Pts % 20 62 14 2 2 15 60 20 4 1
25-54 yrs (n=118) 25-54 yrs (n=545) 65-74 yrs (n= 64) 65-74 yrs (n=418) New Patients Creatinine Clearance at EntryApril 1998 - March 1999 % Australia New Zealand
Diabetic (n=370) Diabetic (n=141) Other-NoAN (n=737) Other-NoAN (n=169) New Patients Creatinine Clearance at EntryApril 1998 - March 1999 % Australia New Zealand
% HD (n=951) % HD (n=112) % PD (n=540) % PD (n=200) New Patients Creatinine Clearance at EntryApril 1998 - March 1999 % Australia New Zealand
% Australia % New Zealand Early Start Treatment April 1998 - March 1999Proportion of New Patients with Creatinine Clearance 10 mls/min Total Aust 370 84 175 862 639 852 545 418 1133 358 NZ 141 2 41 128 122 190 118 64 220 92